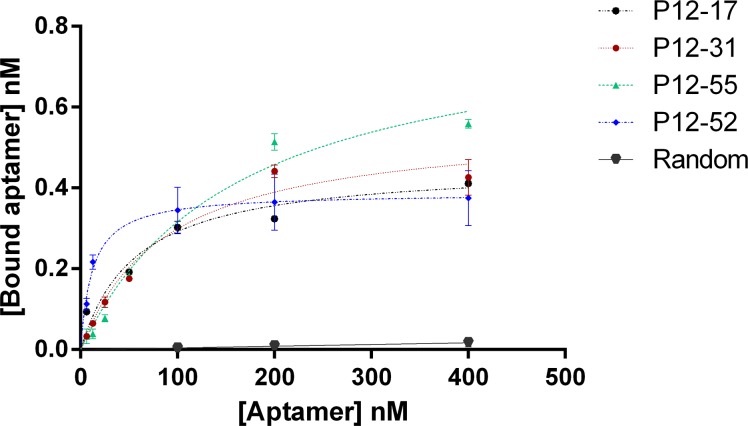
Fig 4. Binding affinity of selected pool 12 aptamers to E coli ATCC 25922.
Binding affinity curves of aptamers P12-17, P12-31, P12-52 and P12-55 to live E coli ATCC 25922. Aptamer binding was quantified by qPCR. Data represent mean ± SD values of three independent experiments. The binding analysis was performed using GraphPad Prism 6, under the non-linear fit model for specific binding.

