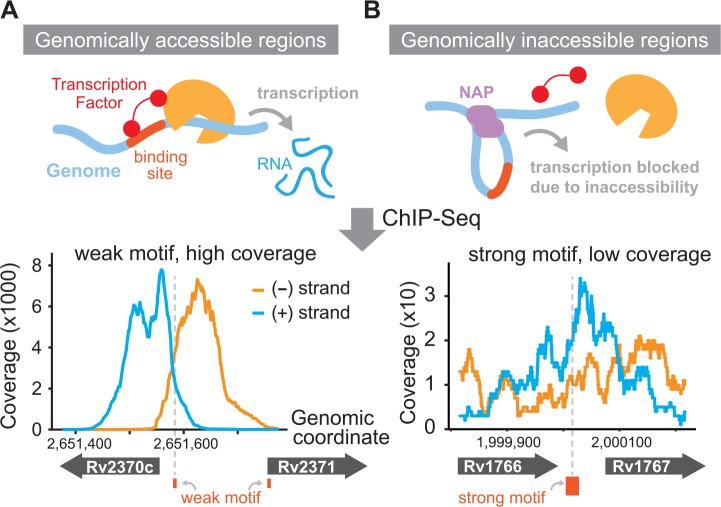
Fig 1. The role of genome accessibility in TF-binding in vivo.
The genome accessibility model differentiates genomic regions as accessible (A) or not accessible (B). ChIP-seq data show that coverage cannot be explained by binding affinity alone. Example data is shown for an accessible region (A) that has a weak binding site (small purple box, p-value ~ 5x10⁻⁴) and high ChIP-seq coverage. The gray dashed line indicates the location of the TF-binding site motif. Example data is shown for an inaccessible region (B) with a strong binding site (big purple box, p-value ~ 5x10⁻⁶) but low coverage. Example data shown are for M. tuberculosis DosR ChIP-seq experiments [15].

