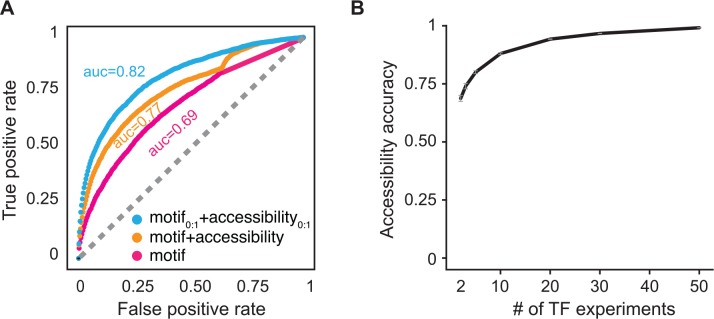
Fig 3. Genome accessibility improves binding peak prediction in ChIP-seq profiles.
Reference ChIP-seq peaks are defined according to method previously described [15]. A receiver and operator characteristic curve is shown in panel (A). Three models are presented for de novo peak prediction (see main text for details). The accessibility parameter (blue and orange lines) increases peak prediction from 0.69 to 0.82 in comparison to a model that only accounts for motif score (violet-red line). (B) Accuracy of genome accessibility estimation as a function of number of ChIP-seq experiments. The accuracy of accessibility values is defined as the Pearson correlation between the estimated values for a subset of ChIP-seq experiments and the one estimated for entire dataset (S2 Fig). The expected accuracy of accessibility values is defined as the mean value of 100 samples. Error bars represent one standard error.

