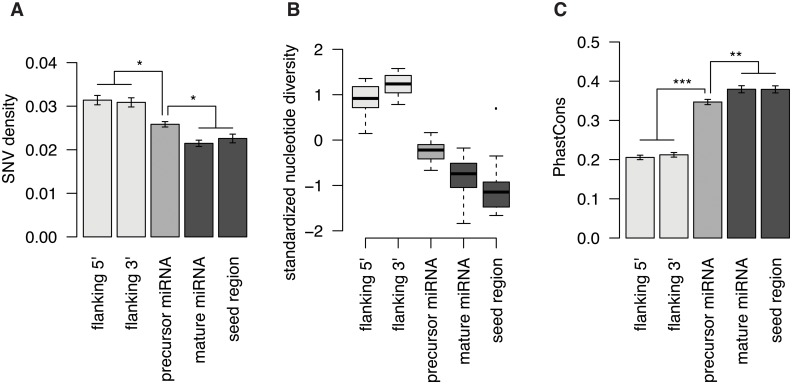
Fig 1. Variation across miRNA (precursor, mature and seed) and flanking (3’ and 5’) regions, in the great ape populations.
(A) Single nucleotide variant (SNV) density calculated as the average number of fixed substitutions in concatenated regions within each population. (B) Boxplot showing standardized (Z-score) nucleotide diversity (pi). (C) Average PhastCons conservation scores. Regions with no statistically significant differences share the same color. Asteriks represent statistically significant differences. Error bars in (A) and (C) represent the standard error of the mean.

