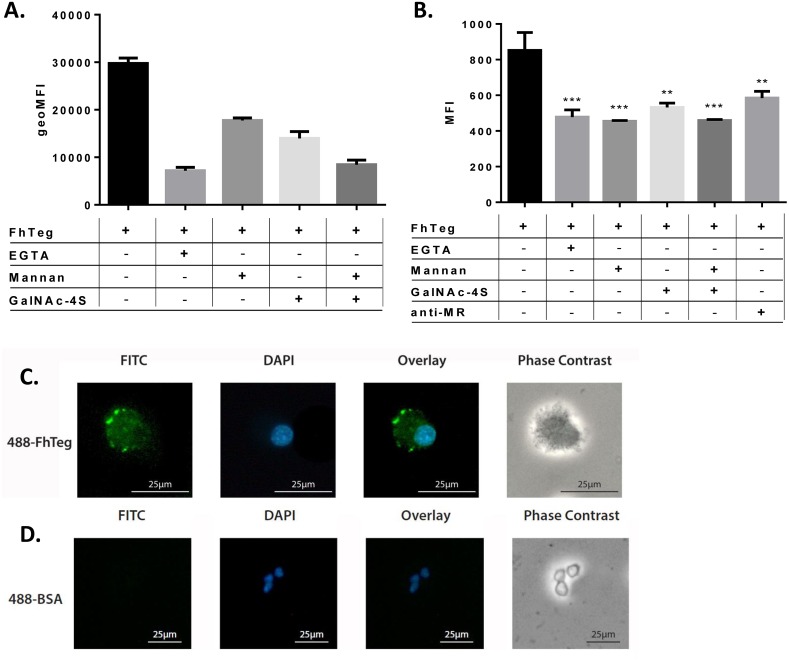
Fig 4. FhTeg binding to dendritic cells is mediated by MR and is carbohydrate and calcium dependent.
A-B: MR-transfected CHO cells (A) and BMDCs (B) were stimulated with and without inhibitors, i.e. EGTA (10mM), anti-MR (1 μg ml-1), mannan (A: 100 μg ml-1;B: 1 mg/mL), GalNAc-4S (A: 1mM; B: 25 mM), for 45 min prior to stimulation with fluorescently labelled FhTeg (A: 1–10 μg ml-1; B: 5 μg/mL) for 45 min. Fluorescently labelled BSA was also used as control. FhTeg binding to cells was assessed by flow cytometry and reported in bar chart format. Data shown is the mean ± SD of one representative experiment; the experiment was repeated 2–3 times, **, p ≤ 0.01; ***, p ≤ 0.001 compared to FhTeg. C-D: BMDCs were stimulated with fluorescently labelled FhTeg (10μg ml-1, green) or BSA (10g ml-1, green)) for 45 min prior to paraformaldehyde fixation and mounting with DAPI (blue); Scale bar: 25μm.

