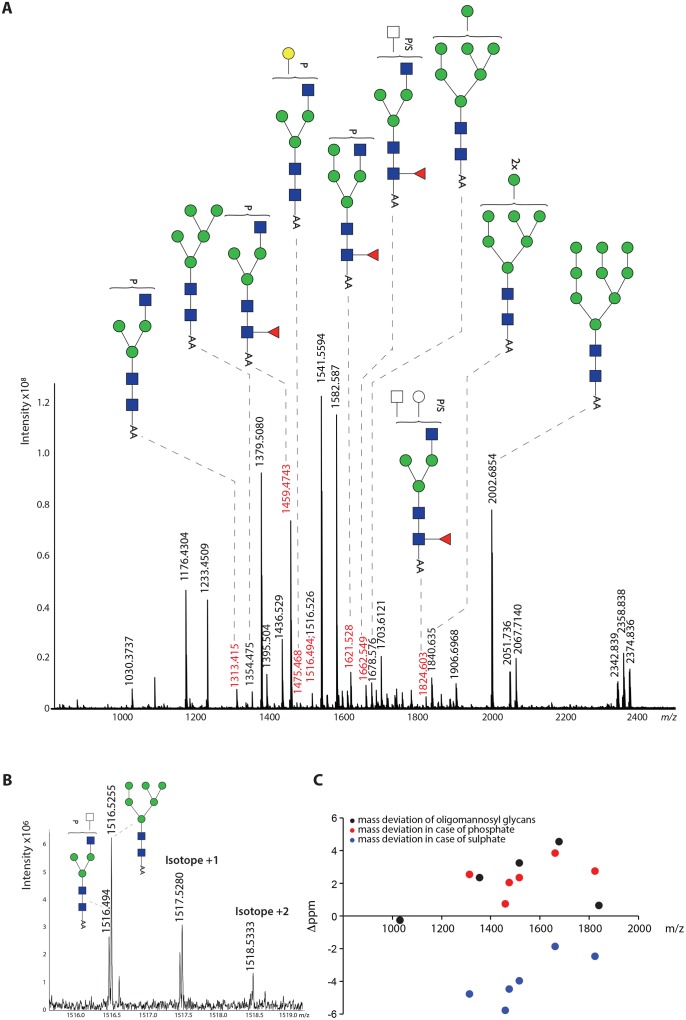
Fig 6. MALDI-FT-ICR-MS analysis of FhTeg N-glycans indicates the presence of phosphorylated glycan species.
A: FT-ICR-MS spectrum indicating the phosphorylated glycans identified by accurate mass determination with external calibration and additional comparison with the internal confirmed oligomannose glycans. B: Zoom region showing the high resolution separation between the Man6GlcNAc2 glycan and a phosphorylated glycan of almost identical mass. C: The scatter plot indicates the deviation of the measured m/z from the calculated m/z of phosphorylated glycans in comparison with hypothetical sulphated glycans and the oligomannosyl glycans also present in the spectrum.

