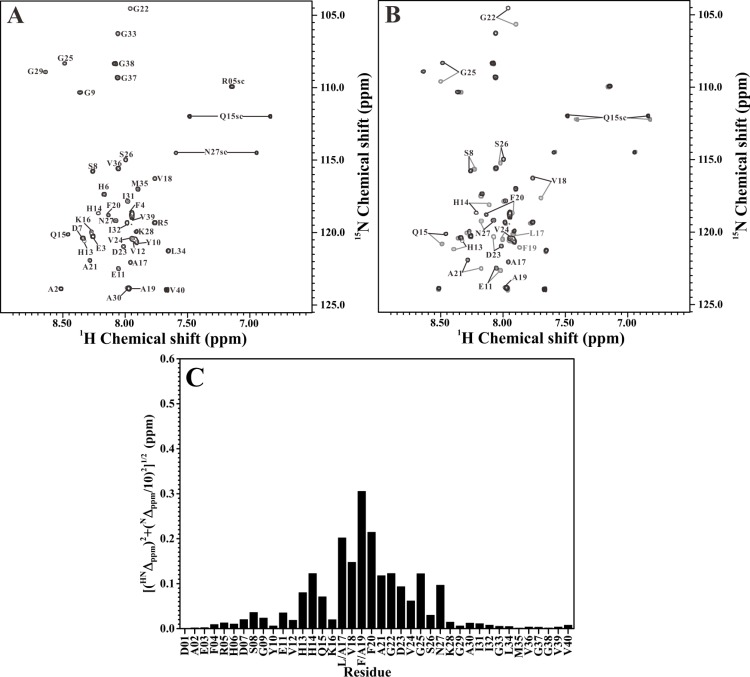
Fig 3. Comparison of the 2D 1H-15N-HSQC spectra of Aβ40(E22G) and Aβ40(L17A/F19A/E22G).
(A) 2D 1H-15N-HSQC spectrum of Aβ40(L17A/F19A/E22G) in 100 mM SDS solution. (B) Superimposition of 2D 1H-15N-HSQC spectra of Aβ40(L17A/F19A/E22G) (black) and Aβ40(E22G) (light grey) in 100 mM SDS solution. Residues with noticeable chemical shift changes were labeled. (C) The effect of L17A/F19A replacements on the backbone resonances of Aβ40(E22G). The weighted chemical shift differences ([(HNΔppm)2+(NΔppm/10)2]1/2) were plotted as a function of residue number. HNΔppm and NΔppm were the 1HN and 15N chemical shift differences between Aβ40(E22G) and Aβ40(L17A/F19A/E22G), respectively.

