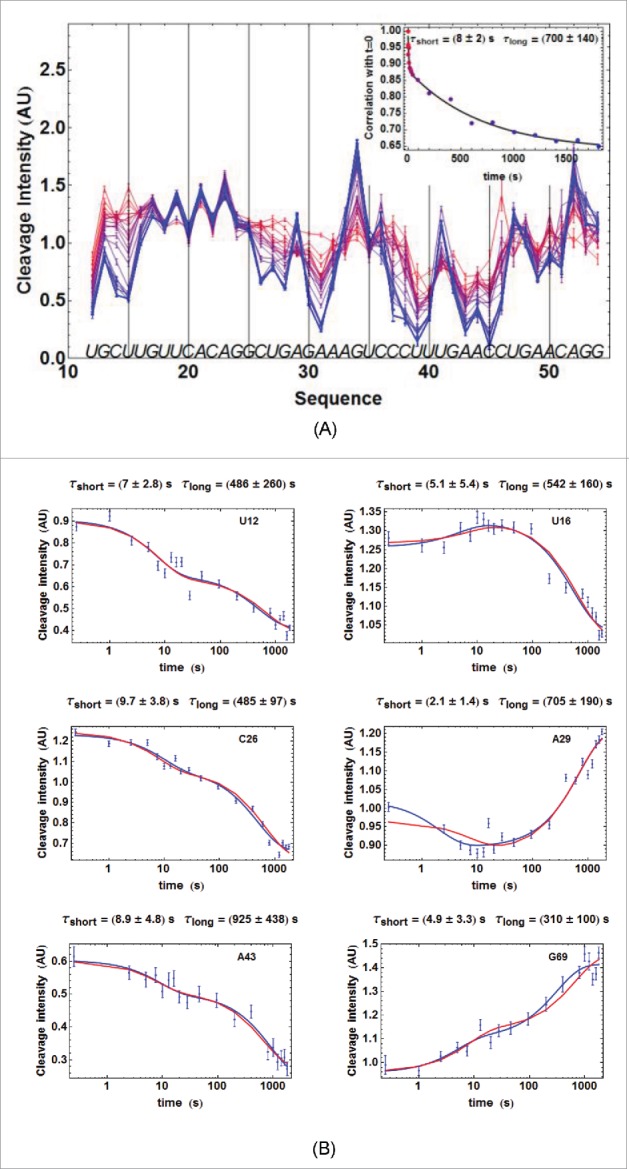
Figure 3.

For figure legend, see next page.Figure 3. (figure previous page) Kinetics of ATthiC cleavage from •OH footprinting. (A) Each color corresponds to a particular time after TPP addition from t = 0 (pure red), to t = 30 min (pure blue). The times were 0, 1, 2.5, 5, 7.5, 10, 13, 16, 20, 28, 46, 95, 200, 400, 800, 1000, 1200, 1400, 1600 and 1800 s. Conditions: TPP 2 µM, magnesium acetate 2 mM, sodium cacodylate buffer 5 mM, pH 6.5, 25 °C. The fact that no cleavage variation was observed from G17 to G24, which was not imposed in the processing, is a good indication of the quality of the overall quantification procedure since these residues form a quickly folded apical loop not susceptible to be influenced by TPP binding. Cleavage curves for selected residues are shown in Fig. 3B. A typical gel is shown in Fig. SD-3D. The inset shows the correlation of each cleavage curve with the cleavage curve for t = 0 as a function of time, which highlights the biphasic character of the kinetics. (For this correlation curve, the experimental data in the main figure, limited to the residue range U12-G54, were supplemented with other data to cover the wider residue range U12-G69).The solid curve is from a bi-exponential fit; the resulting times τshort and τlong from the fit correspond well with those obtained for individual cleavage curves in Fig. 3B. (B) Kinetics of •OH cleavage for selected residues of ATthiC. The experimental points are those for six particular residues (U12, U16, C26, A29, A43 and G69) from Fig. 3A and from other data (not shown). A few experimental points were flagged as outliers and suppressed (e.g., t = 1 s for A29 and A43). The two kinds of fit mentioned in the text are shown: in blue, the simple bi-exponential fit (equation 4) and, in red, the fit making use of kinetic model #1 proved to be the correct one in the following (see Fig. SD-10 for an assessment of the quality of fit). The times and reported for each residue result from the bi-exponential fit and are related to and in equation (4) by and .
