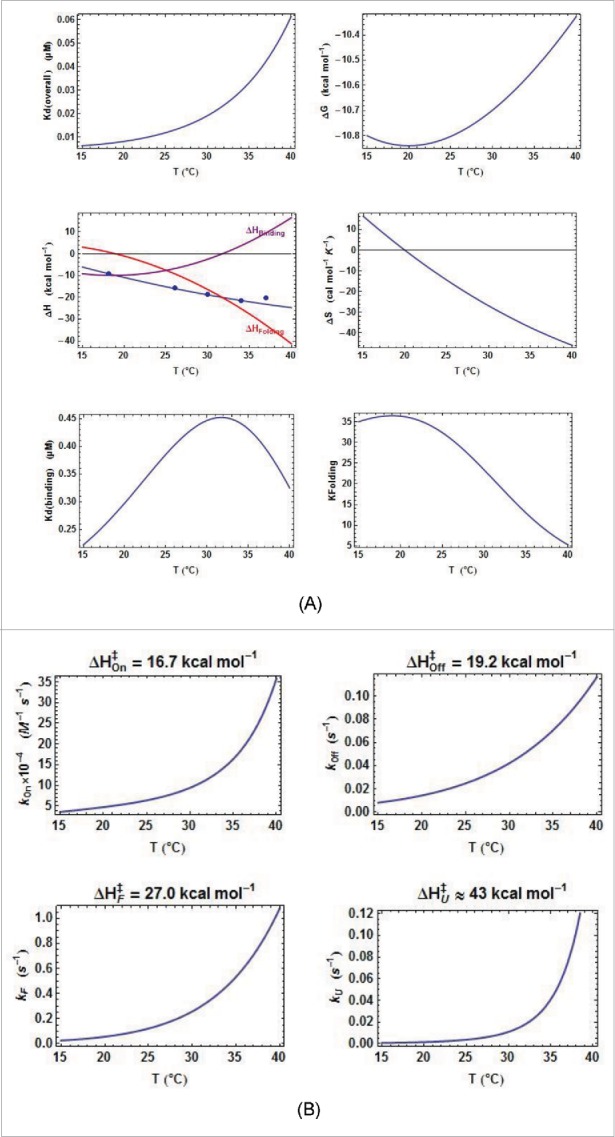
Figure 4.

Thermodynamic and kinetic results from kinITC for ECthiM. (A) Thermodynamic results. The evolution with the temperature of the thermodynamic parameters of all steps in equations 1a,b was obtained with kinITC used with model #1. The figures for ΔG and ΔS refer to the complete reaction involving TPP binding and RNA folding. The figure for ΔH collects ΔHBinding, ΔHFolding (dashed curve) and ΔHITC = ΔHBinding + ΔHFolding shown in blue with the individual values obtained by normal use of ITC at five different temperatures (blue dots). Note the extremum of Kd reached at the temperature where ΔHBinding = 0 in agreement with the Van't Hoff equation linking Kd(binding) and ΔHBinding. This extremum is here a maximum because is positive. The injection curves of the kinITC experiments at different temperatures and their fit are shown in Fig. SD-5C. (B) Kinetic results. The evolution with the temperature of all kinetic parameters in equations 1a,b was obtained with kinITC used with model #1. The activation energies and were obtained as adjustable parameters in kinITC, and and were deduced from and , respectively.
