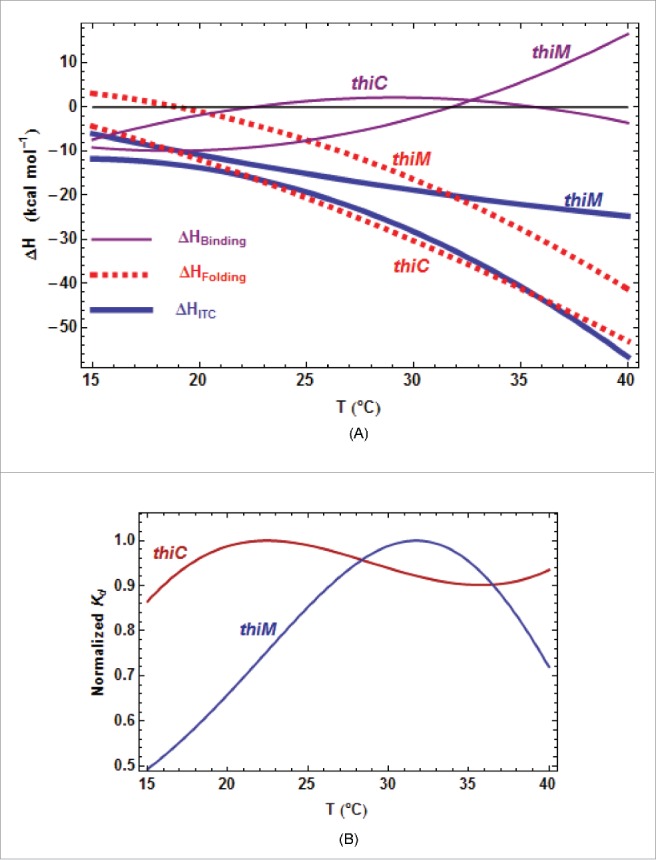
Figure 5.

Comparison of the thermodynamic parameters for E. coli riboswitches. A. Comparison of all ΔH terms from kinITC. The three curves are related by ΔHITC= ΔHBinding+ ΔHFolding. The pattern is similar for the two E. coli riboswitches: the two ΔHBinding curves cross ΔHBinding= 0 at nearby temperatures and the two ΔHFolding curves are quasi parallel. B. Quasi absence of temperature variation for Each curve has been normalized to a unit value at its maximum (0.93 µM for ECthiC and 0.45 µM for ECthiM). is almost constant for ECthiC and varies at most twofold for ECthiM in a broad temperature range in comparison of which varies tenfold for ECthiM (Fig. 4A) and more than thirtyfold for ECthiC (Fig. SD-7A).
