
Figure 6.
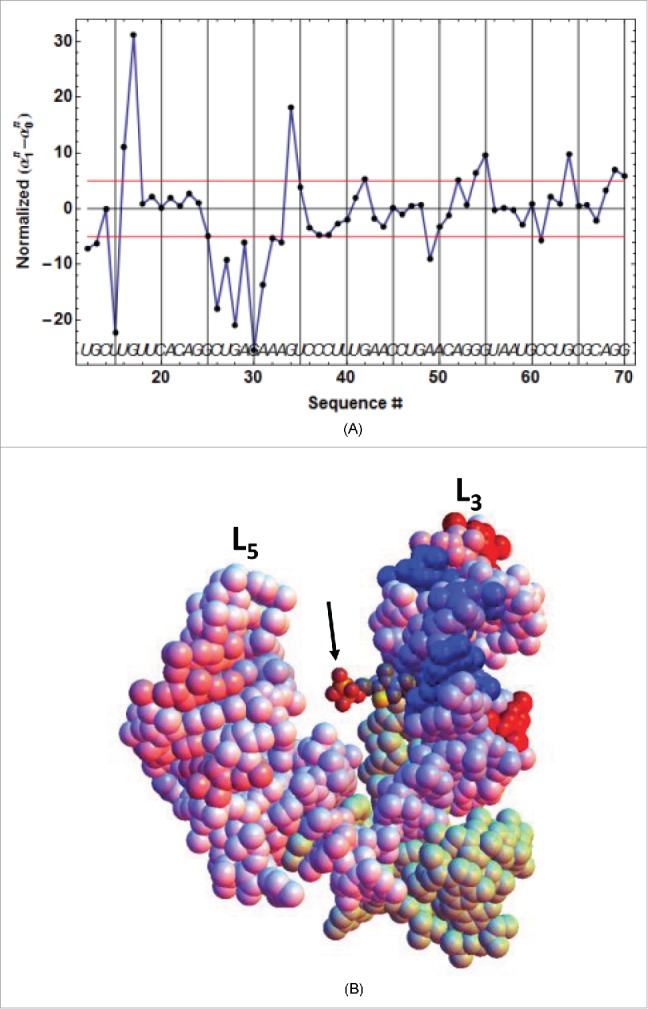
Primary TPP/RNA interaction for ATthiC. (A) The evolution along the sequence of the normalized difference (see text) is shown. A large negative (resp. positive) value of the difference is the mark of early protection against cleavage (resp early enhanced cleavage) after TPP addition. The red lines mark the positive and negative limits at a 5σ threshold. B. The closed riboswitch from the crystal structure has been opened to visualize the primary interaction of the TPP with the RNA; only the pyrophosphate of the TPP is visible (arrow). The loops L5 and L3 are labeled (Fig. 2D). The colors evolve from pure blue to pure red for, respectively, the most negative and most positive values of the normalized difference shown in Fig. 6A. The greenish color corresponds to the 5′-end and 3′-end residues for which no accurate results were obtained. All significantly negative values (pure blue), as well as the highest positive values (pure red), are exclusively located around the interaction site of the TPPpyrimidine moiety.