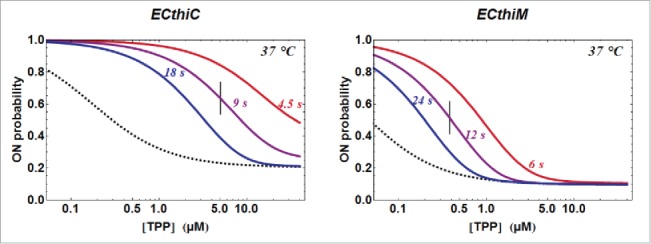
Figure 7.

TPP concentration dependence of the kinetic regulation by ECthiC and ECthiM. The dependence of on the TPP concentration from equation (3) is shown (solid curves) for a common temperature (37°C) and for three values of . The value for each middle curve (9 s for ECthiC and 12 s for ECthiM ) corresponds to the experimental pausing time observed at 37°C with NusA. The vertical bar on each middle curve marks the inflection point where the regulation efficiency is maximum. The two other curves corresponding to half and twice the pausing time are shown to illustrate the effect of this parameter on the regulation. The black dashed curves correspond to that would be obtained if each riboswitch was thermodynamically, and not kinetically controlled, which emphasizes the strong kinetic character of the regulation.
