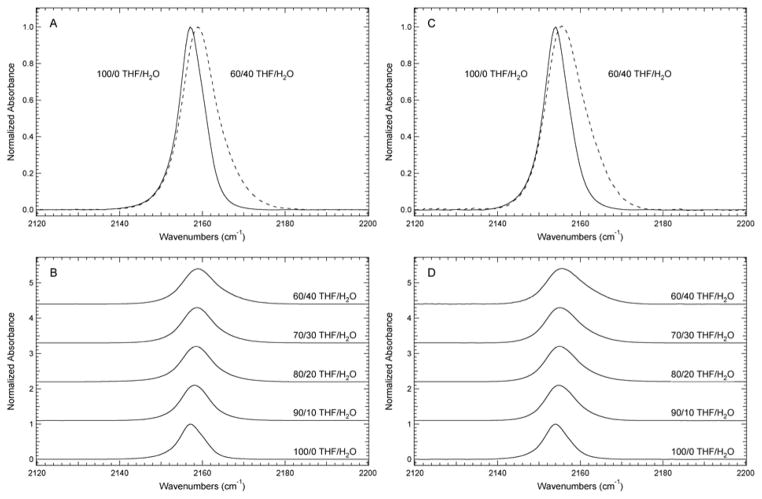
Figure 3.
FTIR absorbance spectra of (A) Si2-dA-SCN and (C) Si2-dA-SeCN dissolved in THF and 40% (v/v) H2O/THF. FTIR absorbance spectra of (B) Si2-dA-SCN and (D) Si2-dA-SeCN dissolved in H2O/THF mixtures from 0–40% (v/v) in 10% intervals. The spectra were recorded at 25°C, baseline corrected, and intensity normalized. The concentration of the samples was 40 mM except for the 40% (v/v) H2O/THF samples, which were 30 mM due to solubility limitations.

