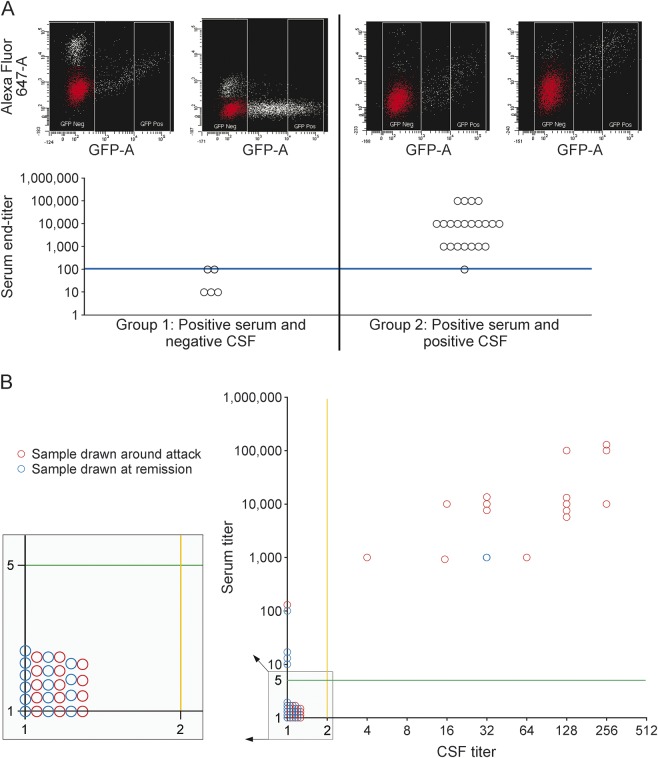
Figure 3. Fluorescence-activated cell sorting (FACS) assay for matched serum and CSF samples.
(A) Aquaporin-4 immunoglobulin G titer of serum samples stratified by time-matched paired CSF sample serostatus. Group 1: Serum is positive but the paired CSF is negative. Group 2: Both serum and CSF are positive. FACS results for serum and CSF samples are shown for patient 15 (group 1) and patient 36 (group 2). DIVA software is used to determine the median fluorescent values of the AlexaFluor 647 signal for both the GFP-negative and positive populations. The main GFP-negative population (illustrated in red) is determined using a histogram with AlexaFluor 647 signal (x-axis) vs counts (y-axis) and a snap-to-interval gate within the software that distinguishes the main GFP-negative population. The blue line shows that the serum titer >1:100 predicted CSF positivity. (B) Comparing serum and CSF end titer in samples drawn around an attack (preattack, attack, and attack/remission bridge) with those drawn during remission. Samples left to the orange solid lines are negative in CSF. Samples below the green solid lines are negative in serum.

