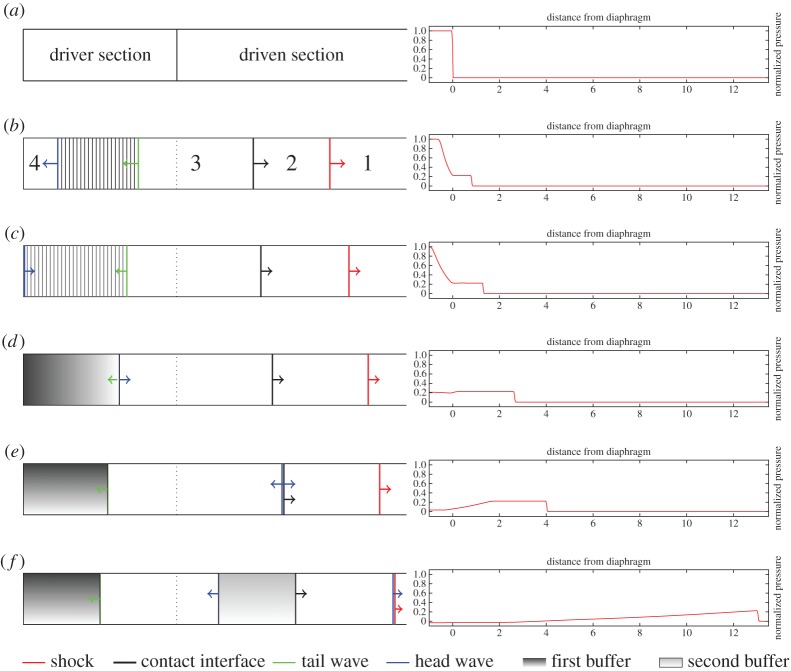
Figure 1.
Schematic of the evolution of the shock wave structure in the shock tube (left figures) and evolution of the pressure profile (right figures). (a) Initial configuration of the shock tube, (b) Riemann structure of the flow following diaphragm rupture, (c) the head wave arrives at the wall, (d) the head wave exits the buffer region after reaching the tail wave, (e) the head wave arrives at the contact interface and (f) the head wave arrives at the shock wave. (Online version in colour.)

