
Figure 2.
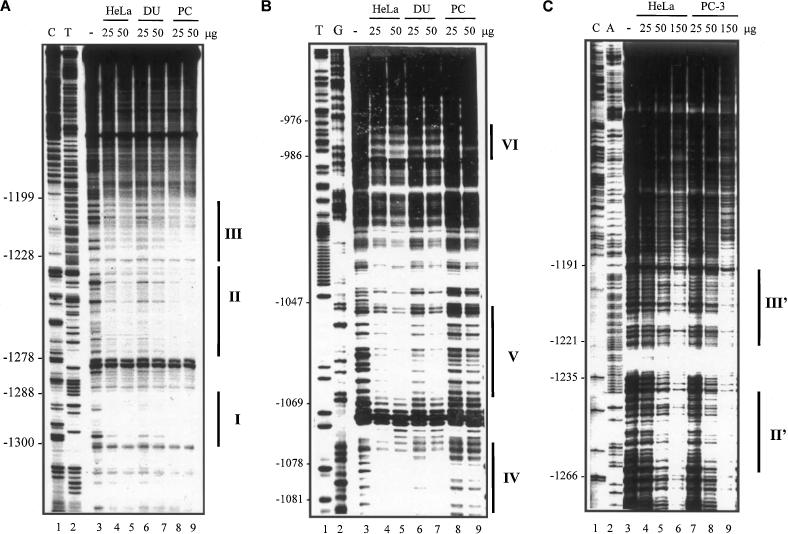
DNase I footprinting analysis of the PAcP promoter. The labeled fragments (as described in Materials and Methods) were reacted with nuclear extracts from HeLa, DU 145 and PC-3 cells, respectively. The data obtained with the coding strand of −1356/−992 bp DNA are shown in the autoradiogram (A), those obtained with −1111/−737 bp DNA are shown in (B), and those obtained with the protection of the non-coding strand −1356/−731 are shown in (C). The protected promoter sequences were determined by a direct comparison with the sequencing reaction. (A) Lanes 1 and 2, sequencing ladders; lane 3, control DNase I reaction of probe DNA without nuclear extracts; lanes 4 and 5, 25 and 50 μg, respectively, of HeLa cell nuclear extracts; lanes 6 and 7, 25 and 50 μg, respectively, of DU 145 cell nuclear extracts; lanes 8 and 9, 25 and 50 μg, respectively, of PC-3 cell nuclear extracts. (B) Lanes 1 and 2, sequencing ladders; lane 3, control DNase I reaction of probe DNA without nuclear extracts; lanes 4 and 5, 25 and 50 μg, respectively, of HeLa cell nuclear extracts; lanes 6 and 7, 25 and 50 μg, respectively, of DU 145 cell nuclear extracts; lanes 8 and 9, 25 and 50 μg, respectively, of PC-3 cell nuclear extracts. (C) Lanes 1 and 2, sequencing ladders; lane 3, control DNase I reaction of probe DNA without nuclear extracts; lanes 4, 5 and 6, 25, 50 and 150 μg, respectively, of HeLa cell nuclear extracts; lanes 7, 8 and 9, 25, 50 and 150 μg, respectively, of PC-3 cell nuclear extracts.