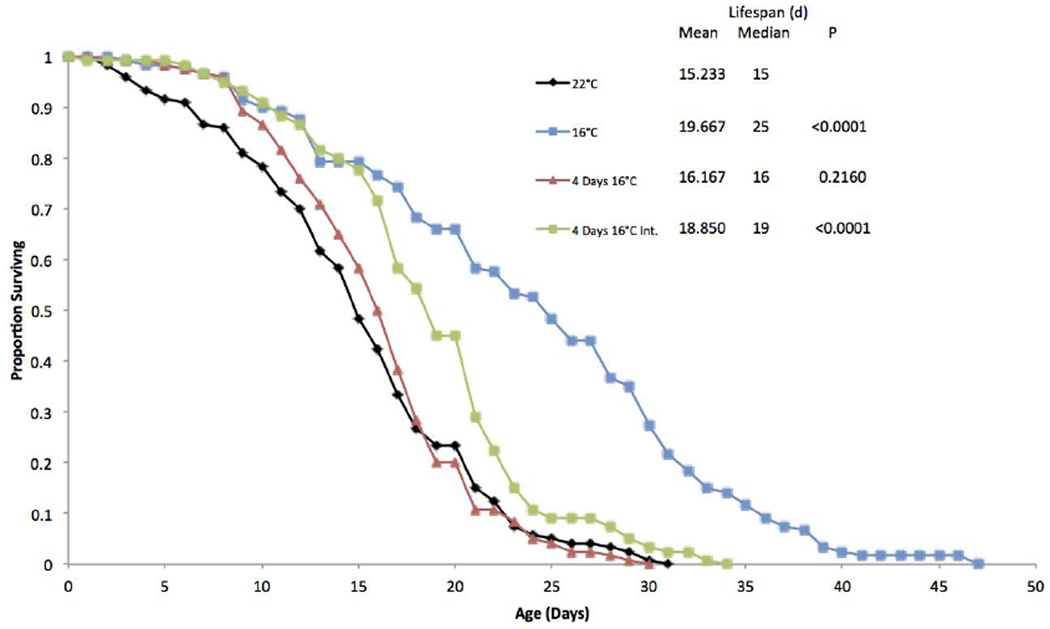
Figure 4.
Survival curves for B. manjavacas incubated at different temperature treatments. 4 Days 16°C was exposed to 16°C only for the first 4 days of life, while the Int. treatment was exposed for 4 days intermittently throughout the lifespan. Proportion surviving represents the fraction of an initial cohort of 120 females surviving to each age. Mean and median lifespan are reported in days, and P represents the Wilcoxon test probability that the treatment curves are similar to the 22°C control.

