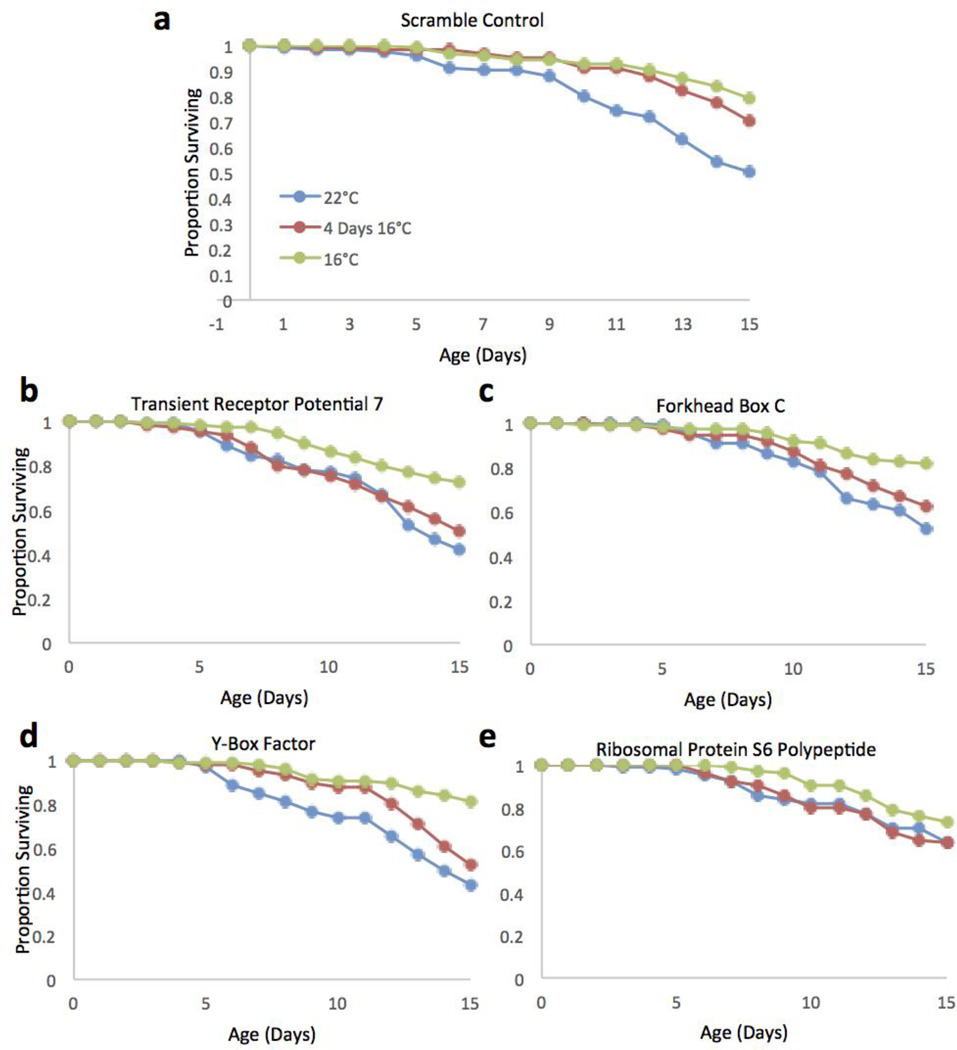
Figure 8.
Survival curves for RNAi treated B. manjavacas incubated at 3 different temperatures. a) Typical curves for the scramble treated control animals at each temperature. b–e) Survival curves for expression knockdown treatments where the persistent survival effect of a 4 day 16°C exposure is eliminated. Proportion surviving represents the fraction of an initial cohort of 120 females surviving to each age.

