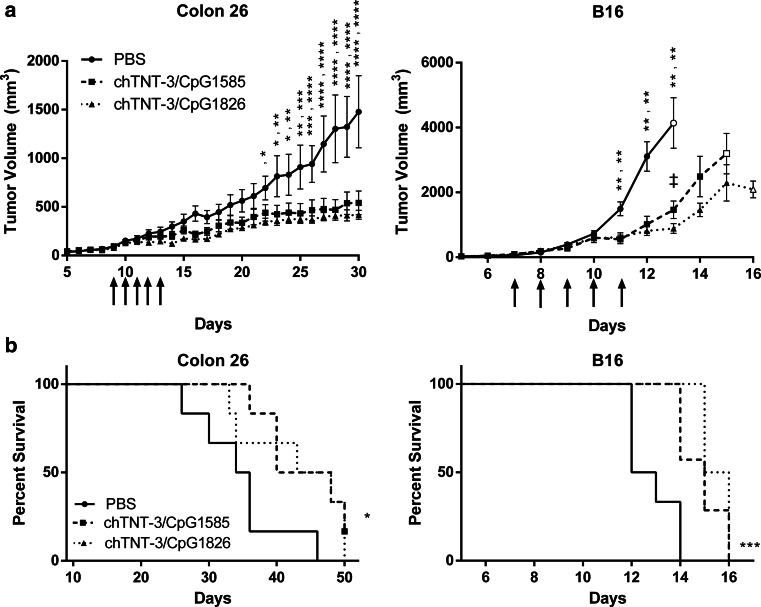
Fig. 3.
Class A and B CpG sequences decreased tumor burden and improved survival in highly (Colon 26) and poorly (B16) immunogenic tumor models when conjugated to chTNT-3. a Tumor volume curves in BALB/c mice-bearing Colon 26 adenocarcinoma and C57BL6 mice-bearing B16 melanoma. Doses of chTNT-3/CpG1585 and chTNT-3/CpG1826 corresponded to 18 µg of CpG. Open symbols represent data points where n = 3–4 mice due to death of mice prior to that time point. Arrows indicate when treatments were administered. Error bars represent SEM. b Kaplan–Meier survival curves, with data symbols representing mice alive at the end of study. Statistically significant differences between chTNT-3/CpG1585 or chTNT-3/CpG1826 and PBS treatment are represented by *p < 0.05; **p < 0.01; ***p < 0.001; ****p < 0.0001. Statistically significant difference between chTNT-3/CpG1585 and chTNT-3/CpG1826 is represented by ‡ p < 0.05. N = 5–7 mice/group

