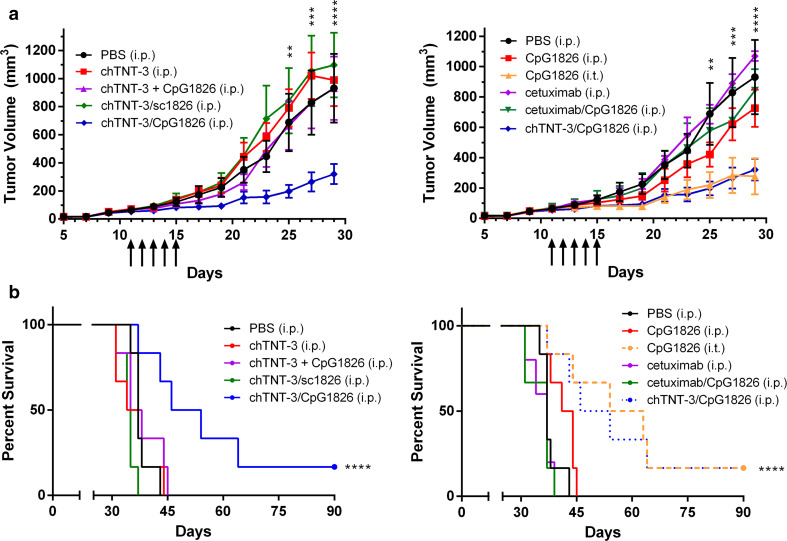
Fig. 4.
Optimal effect on tumor growth required delivery of CpG to the tumor. a Tumor volume curves in BALB/c mice-bearing Colon 26 adenocarcinoma. Treatment groups are divided into two graphs for easier visualization. All doses corresponded to 10 µg of oligo (CpG1826 or sc1826). Arrows indicate when treatments were administered. Error bars represent SEM. b Kaplan–Meier survival curves, with data symbols representing mice alive at the end of the study. Statistically significant differences between chTNT-3/CpG1826 or CpG (i.t.) and PBS treatment are represented by ***p < 0.001; ****p < 0.0001, n = 6 mice/group

