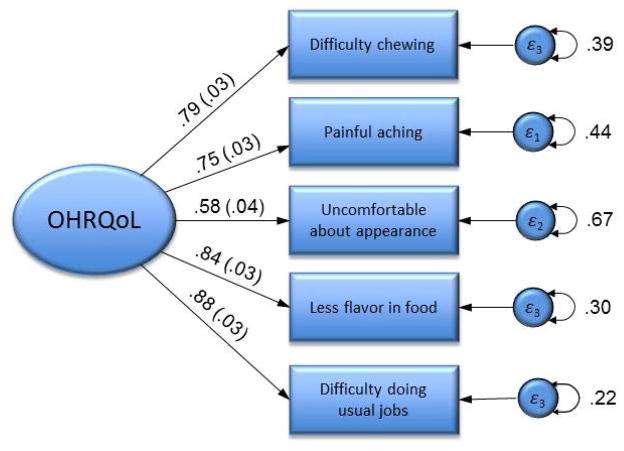
Figure 1. Confirmatory factor analysis model of oral health-related quality of life (OHRQoL) measured with five indicators from OHIP5.
The oval represents the latent factor OHRQoL, and the rectangles represent measured indicators for the latent factor with their error variances (circles). The lines connecting the latent factor to indicators are factor loadings (with their standard errors). Numbers provided are standardized values. Analyses were performed with R and used a diagonally weighted least squares estimation, assuming OHIP items were ordered categorically.

