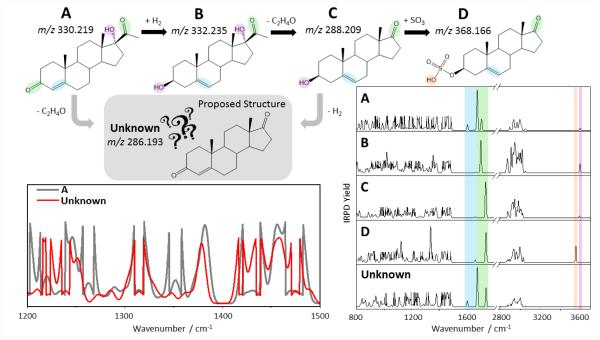
Figure 3.
Illustrative metabolic pathway with known metabolites A-D, and proposed structure for unknown metabolite (top). Comparison of experimental IR spectrum of unknown with reference experimental IR spectra for known metabolites (right), depicting diagnostic vibrations via color coding. Zoom-in of 1200-1500 cm−1 region overlay for known A and unknown (left bottom).

