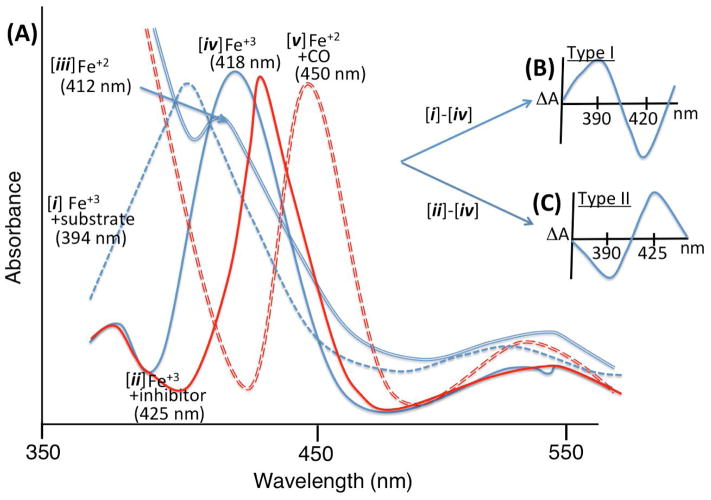
Figure 2.
(A) Cartoon of spectral changes (UV-Vis spectrum) of the heme center with different conditions. Absorption maxima of the Soret band are indicated in parentheses. (B) “Type I” binding difference spectrum. (C) “Type II” binding difference spectrum. For experimental data see reference [18]. The reduction from Fe+3 (ferric) to Fe+2 (ferrous) forms as shown in spectra [ iv ] and [ iii ], respectively, is achieved via addition of solid sodium dithionite.gr2

