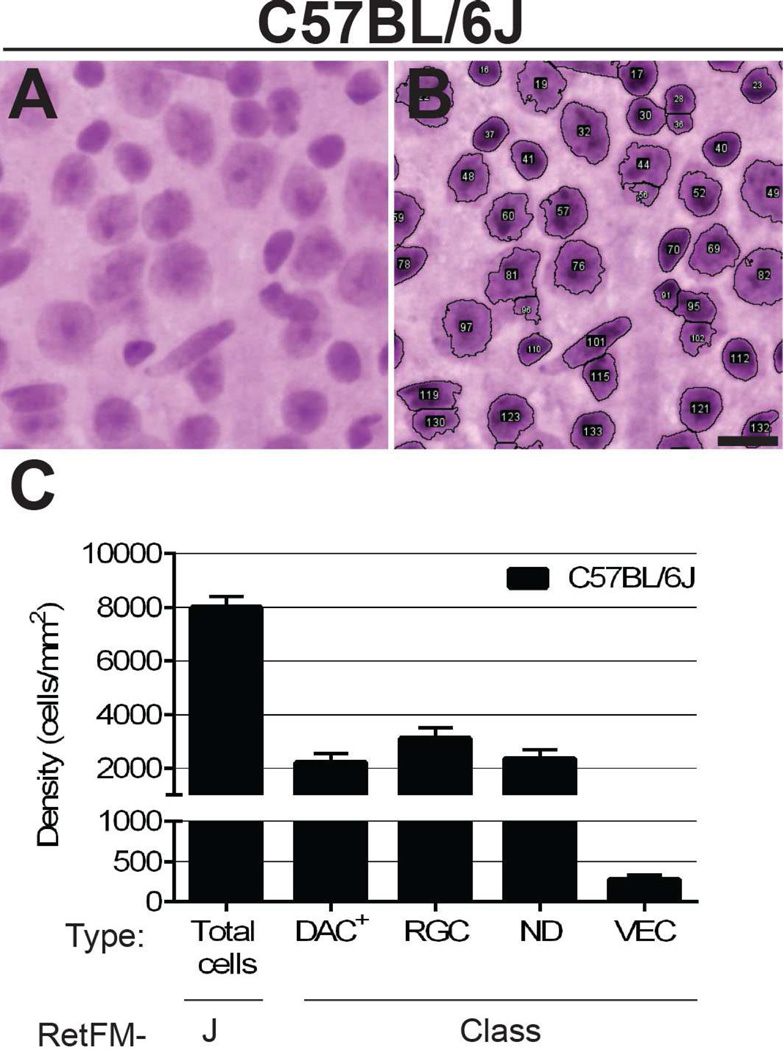
Figure 3. RetFM-J and RetFM-Class performance matches expectations in C57BL/6J mice.
(A) Raw and (B) analyzed images captured from the mid-peripheral zone. Most nuclei are clearly recognized and separated by RetFM-J, but there is less certainty in areas of cell clustering (for example, involving objects 91, 95, and 102 at the lower right). Scale bar = 10µm. (C) Bar graph of cell density versus cell category. Note that the Y-axis is discontinuous and not equally scaled in the upper and lower portions. C57BL/6J mice (n = 10 retinas, 254,135 nuclei); 8–9 wks of age; mean ± 1 SD.

