
Figure 1. Identification of genes down-regulated after long-term stem cell depletion.
(a) Scheme for transcriptional profiling studies. (b) Venn Diagram showing number of genes significantly down-regulated after short-term (green) and long-term (magenta) stem cell depletion. (c) Heat map showing relative gene expression for various treatments and time points. Only a subset of representative genes is displayed.

Figure 1—figure supplement 1. histone H2B is required to maintain proliferative neoblasts.
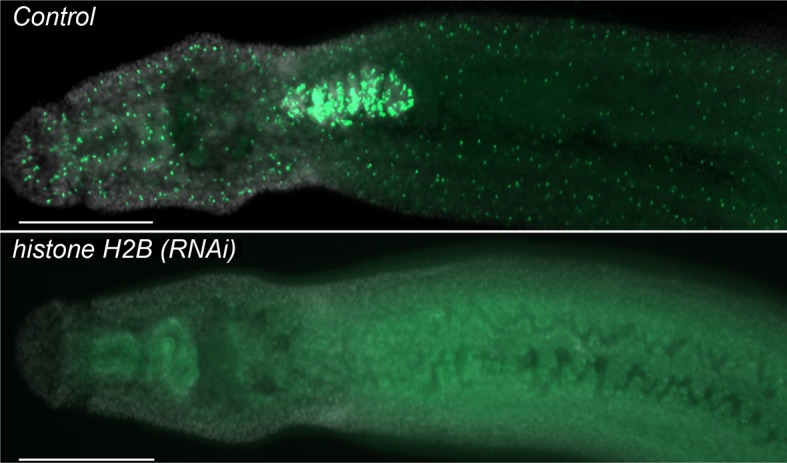
Parasites were treated with either control or histone H2B dsRNA for four days and then labeled at Day 11 overnight with 10 µM EdU and fixed the following day. Parasites treated with histone H2B dsRNA display a rapid and robust loss of neoblasts. n > 5 parasites. Scale bar: 200 µm.
Figure 1—figure supplement 2. val-8 expression is increased 48 hr following irradiation.
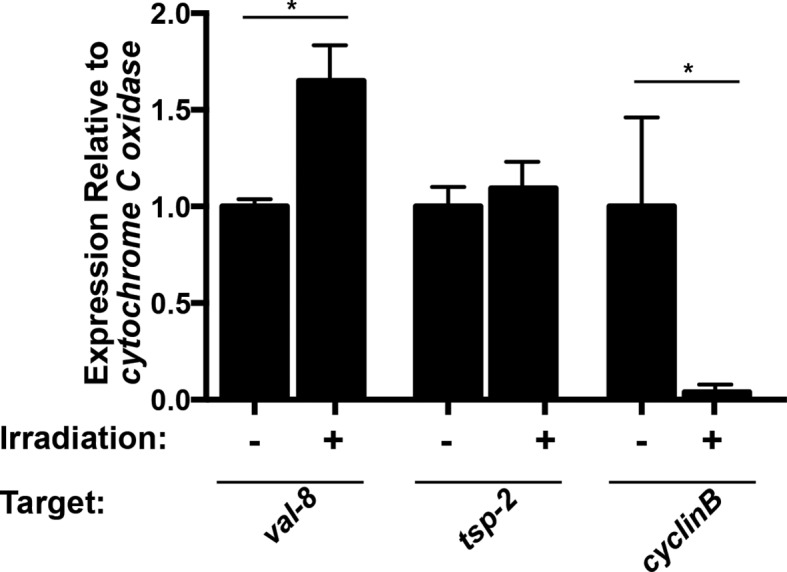
Quantitative real time PCR analysis of val-8 48 hr post-irradiation. Levels of tsp-2 and cyclin B gene expression are shown as negative and positive controls, respectively. n=3 biological replicates, *p<0.005, Student’s t-test.