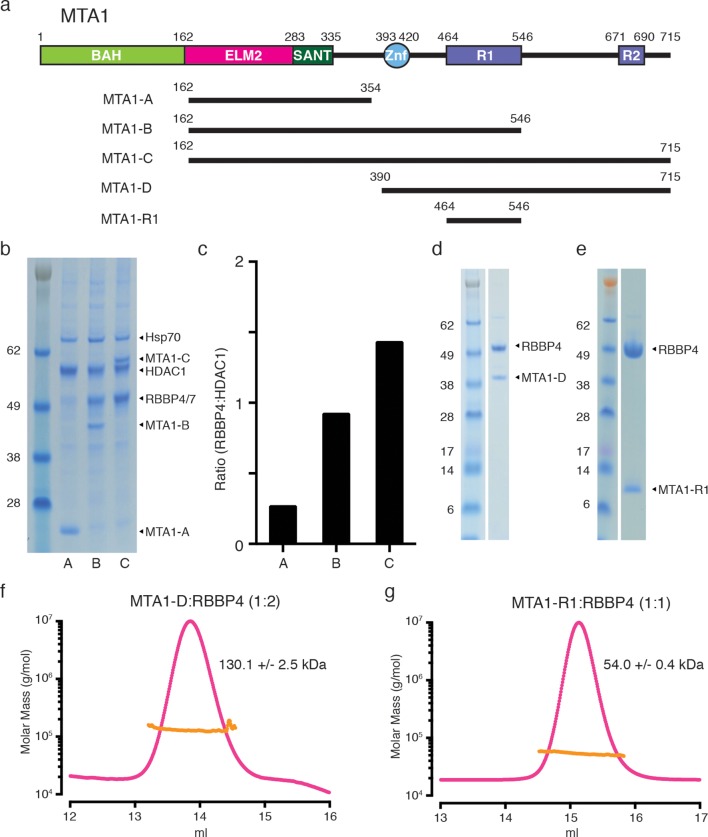
Figure 1. MTA1 co-purifies with endogenous RBBP4/7 in a supra-stoichiometric ratio.
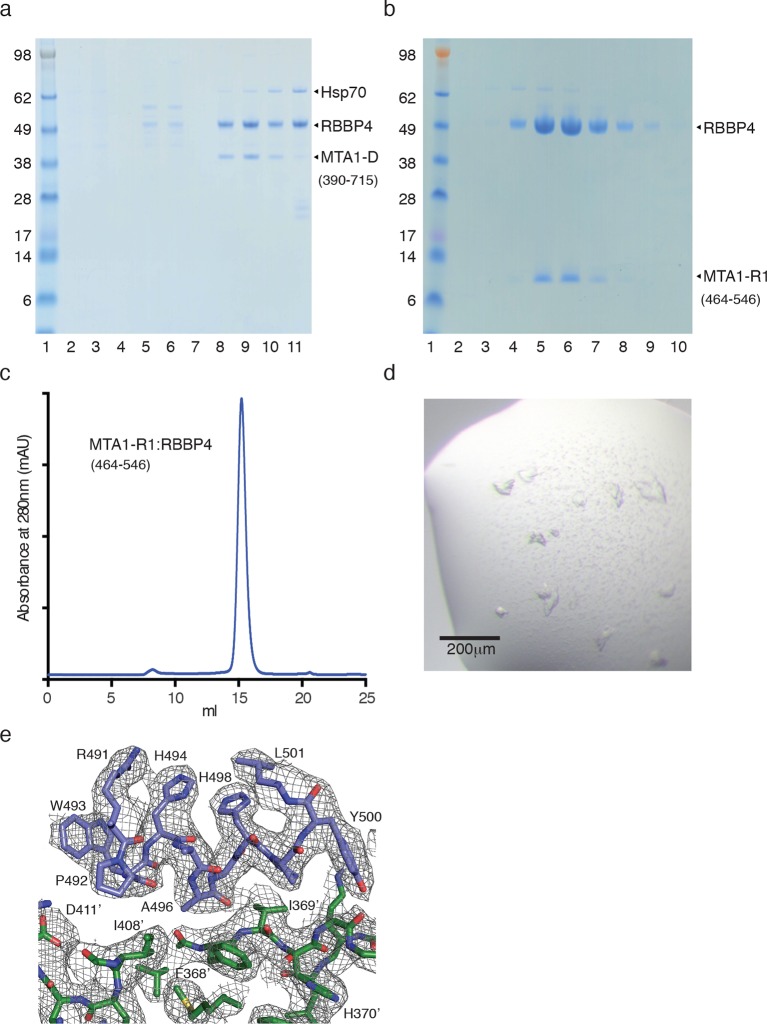
(a) Schematic representation of the domain structure of MTA1, with the R1 and R2 RBBP4 recruitment domains shown in purple. A summary of fragments used in the interaction studies is shown below. (b) MTA1-B and MTA1-C co-purify with endogenous RBBP4/7, as identified by mass spectrometry, in a stoichiometric and a supra-stoichiometric ratio respectively. (c) The ratio of endogenous RBBP4/7 to co-transfected HDAC1 is quantified from the SDS-PAGE gel by densitometry. (d) and (e) Co-expression of the MTA1-D:RBBP4 and MTA1-R1:RBBP4 complexes. (f) and (g) Co-expressed MTA1-D:RBBP4 and MTA1-R1:RBBP4 are shown to form complexes of 1:2 and 1:1 stoichiometry, respectively, as determined by size exclusion chromatography coupled to multi-angle light scattering (MALS). See Figure 1—figure supplement 1 for information about expression, purification and crystallisation.


