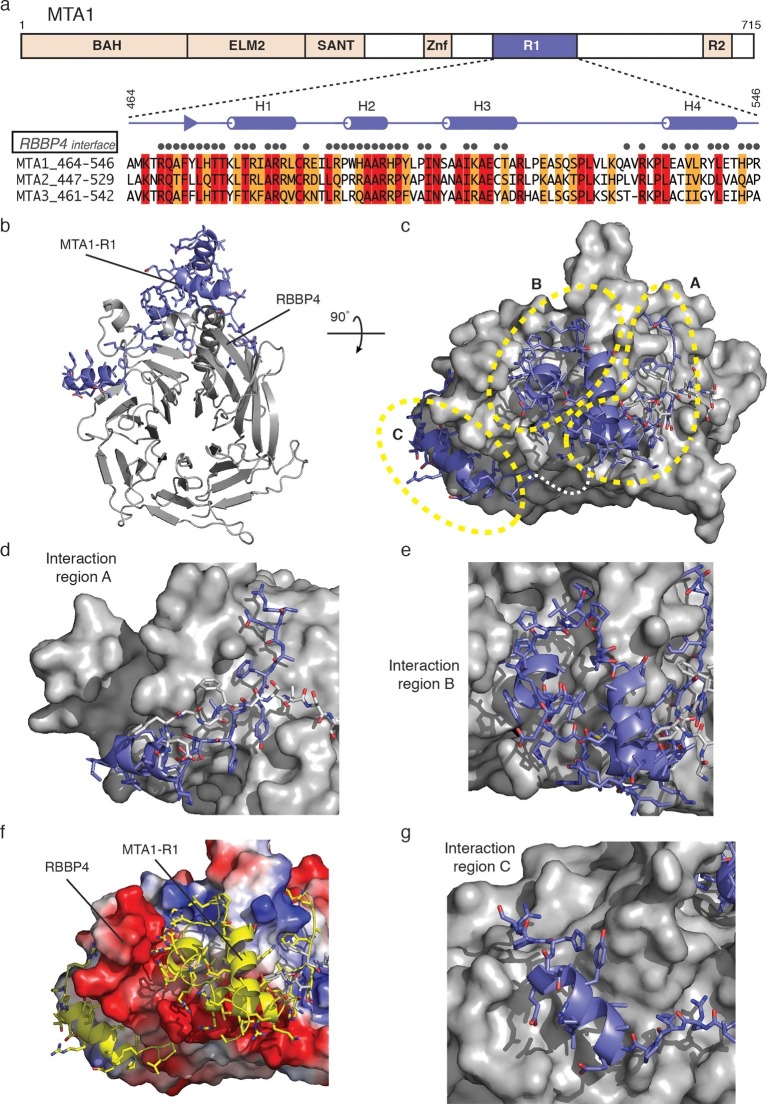
Figure 2. The crystal structure of MTA1-R1 domain bound to RBBP4.
(a) Schematic representation of the domain structure of MTA1. The secondary structure of MTA1-R1 (464–546), corresponding to the R1 domain, is shown. Those residues of MTA1 that form an interface with RBBP4 in the crystal structure are indicated. Below is the sequence alignment of the R1 domains from MTA1, 2 and 3. Residues coloured red are identical and residues coloured orange are conserved. (b) Cartoon representation of the MTA1-R1:RBBP4 complex with MTA1 in purple and RBBP4 in grey. (c) The structure is rotated by 90° and the surface of RBBP4 is shown. The dotted white line indicates the part of MTA1 that is disordered. The 5G loop in RBBP4 is shown as sticks with grey coloured carbon atoms. MTA1-R1 is rationalised into three interaction regions A, B and C and these are shown in more detail in (d), (e) and (g). MTA1 is shown as a cartoon and RBBP4 as a grey surface. (f) Electrostatic surface view of RBBP4 with MTA1 shown in yellow. See Video 1 for a 3D view of the MTA1-R1:RBBP4 complex and Table 1 for the crystallographic data collection and refinement statistics.

