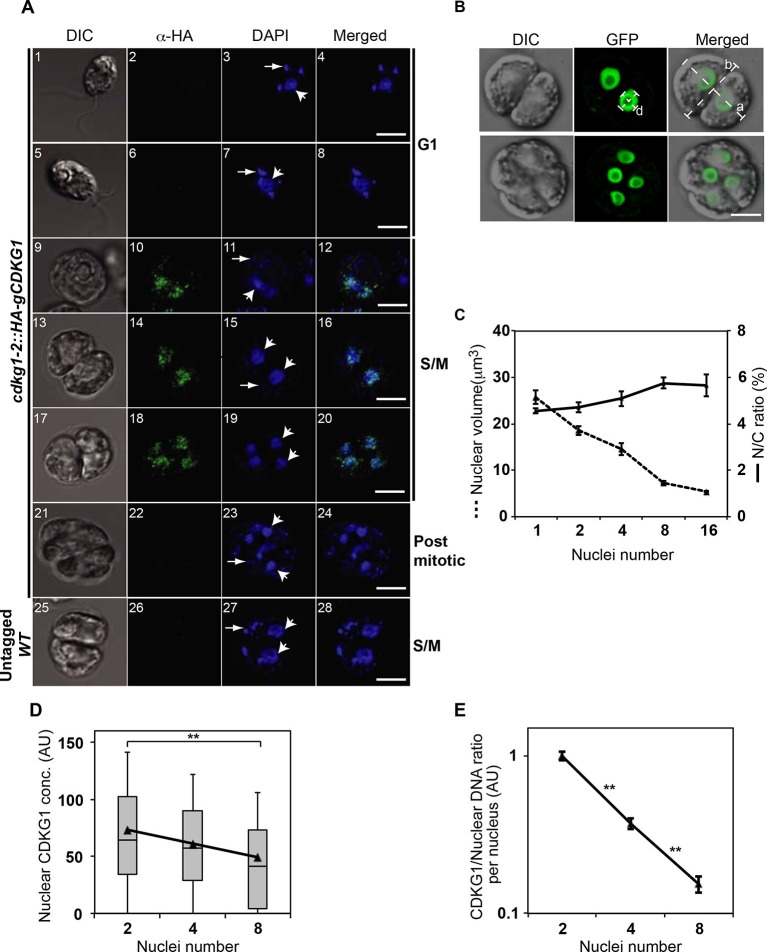
Figure 5. CDKG1 is nuclear localized and degraded as cells divide.
(A) DIC and confocal immunofluorescence microscopy images of cdkg1-2::HA-gCDKG1 (panels 1–24) and untagged wild type (WT) cells (panels 25–28). Synchronized cultures were fixed and immunostained for the HA epitope (green) and stained with DAPI (blue). Panels 1–8 are G1 phase cells, 9–20 are S/M phase cells, and 21–24 are post mitotic cells. Panels 25–28 are S/M phase cells from an untagged control strain. Wide arrows mark representative nuclei; thin arrows mark representative chloroplast nucleoids; Scale bar = 5 µm. Also see Figure 5—figure supplement 1. (B) Live synchronized S/M phase ble-GFP expressing cells were imaged by DIC or with a maximum-projection of Z stacks from the GFP channel. The diameter of a representative nucleus (d) and major (a) or minor (b) axes of the mother cell body are marked as white dashed lines. Scale bar = 6 µm. (C) Graph of nuclear volume and mean N/C ratio per daughter cell at different division stages plotted against nuclear number. Data are from at least 24 cells per group, except for the 16-cell stage (n=11). Error bars: S.E.M. No significant differences on N/C ratio were detected among groups using a one-way ANOVA test (p=0.09879, d=4). (D) Box-whisker plots of nuclear concentrations of HA-CDKG1 per nucleus against nuclei number (X-axis) from dividing cells at different cycle numbers. Black triangles represent mean values of nuclear HA-CDKG1 concentration per nucleus that used for generating the linear regression (R2=0.99959). Data were collected from at least 68 cells per division stage. Error bar: S.D. **: two-tailed non-parametric t-test between cell groups with 2 and 8 nuclei (p<0.005). (E) Graph of (HA-CDKG1/nuclear DNA) from different division cycle numbers as described in (D). The ratio was calculated as total nuclear HA-CDKG1 immunofluorescence intensity per mitotic cell divided by the genome copy number within that cell cluster. The HA-CDKG1/nuclear DNA ratio in first group was set as 1 arbitrary unit (AU) and plotted against nuclear number. Error bar: S.E.M.. p values of non-parametric t test between adjacent samples are marked. **: significant difference (p<0.0001).


