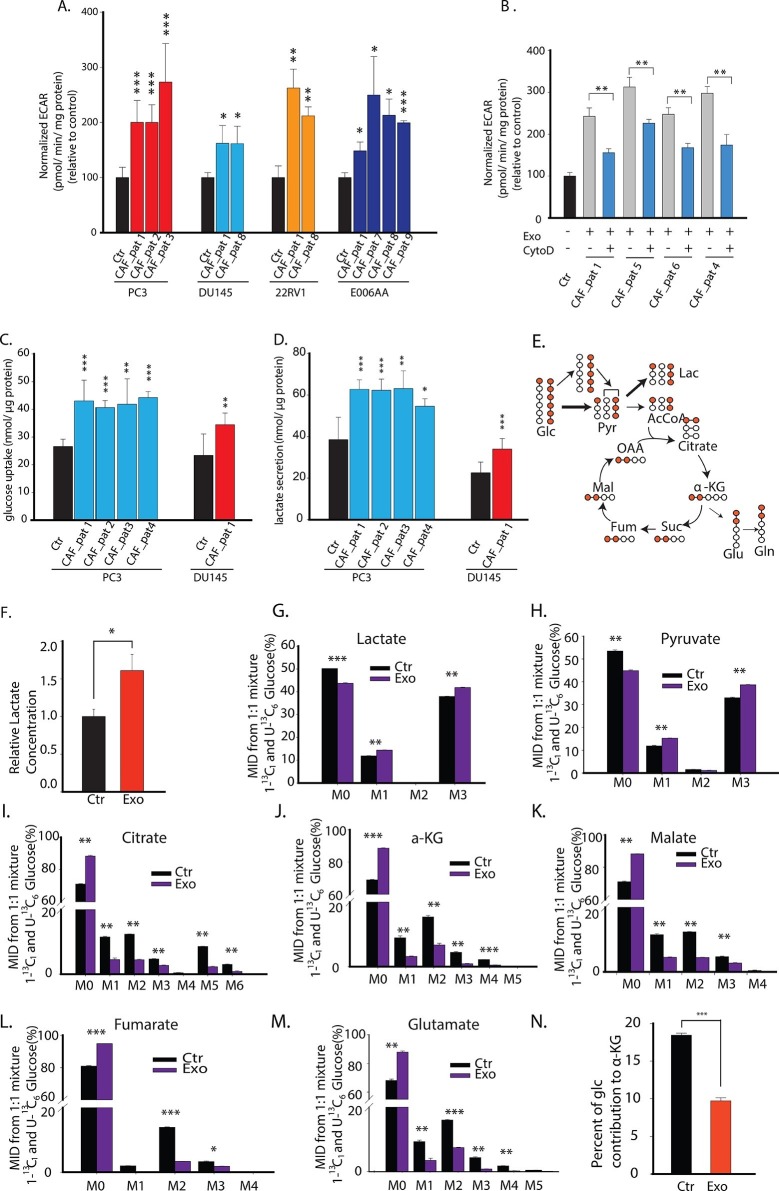
Figure 3. CDEs upregulate glycolysis in cancer cells.
(A) Extracellular acidification rates (ECAR) of prostate cancer cells were measured after 24 hr culture with and without CAFs exosomes. ECAR is a measure of glycolytic capacity of cells. The ECAR was normalized with protein content inside cells. Four prostate cancer cell lines: PC3, DU145, 22RV1, E006AA were used. Six patients derived CAFs were used for exosomes isolation (n≥9). (B) ECAR of prostate cancer cells was measured. CytoD increased ECAR in prostate cancer cells when cultured with CAFs exosomes. CytoD concentration of 1.5 μg/ml was used. (n≥6). (C,D) Effect of CAFs-secreted exosomes on glucose uptake (C) and lactate secretion fluxes (D) in prostate cancer cells. (n=9). (E) Schematic of carbon atom transitions using 1:1 mixture of 13C6 glucose and 1-13C1-labeled glucose. (F) Relative lactate abundances were measured using GC-MS in PC3 cells cultured with and without CAFs-secreted exosomes for 24 hr. (n=4). (G–M) Contribution of glucose towards TCA cycle metabolites and glycolysis is measured using the labeled glucose. Comparison of mass isotopologue distributions (MID) of lactate, pyruvate, citrate, α-ketoglutarate, malate, fumarate, and glutamate in PC3 cancer cells cultured with and without CAFs-secreted exosomes. (n=4). (N) Percentage of glucose contribution to α-ketoglutarate in PC3 cells with and without CAFs-secreted exosomes. (n=4). Data information: data in (A,C and D) are expressed as mean ± SD, data in (B,F–N) are expressed as mean ± SEM; *p<0.05, **p<0.01, ***p<0.001. Figure 3—figure supplement 1.
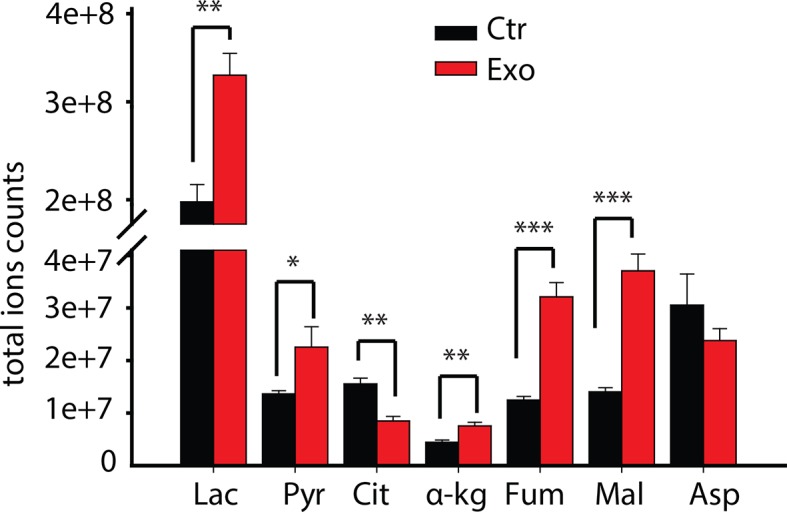
Figure 3—figure supplement 1. Total ion currents of metabolites in PC3 with or without coculture of CDEs.


