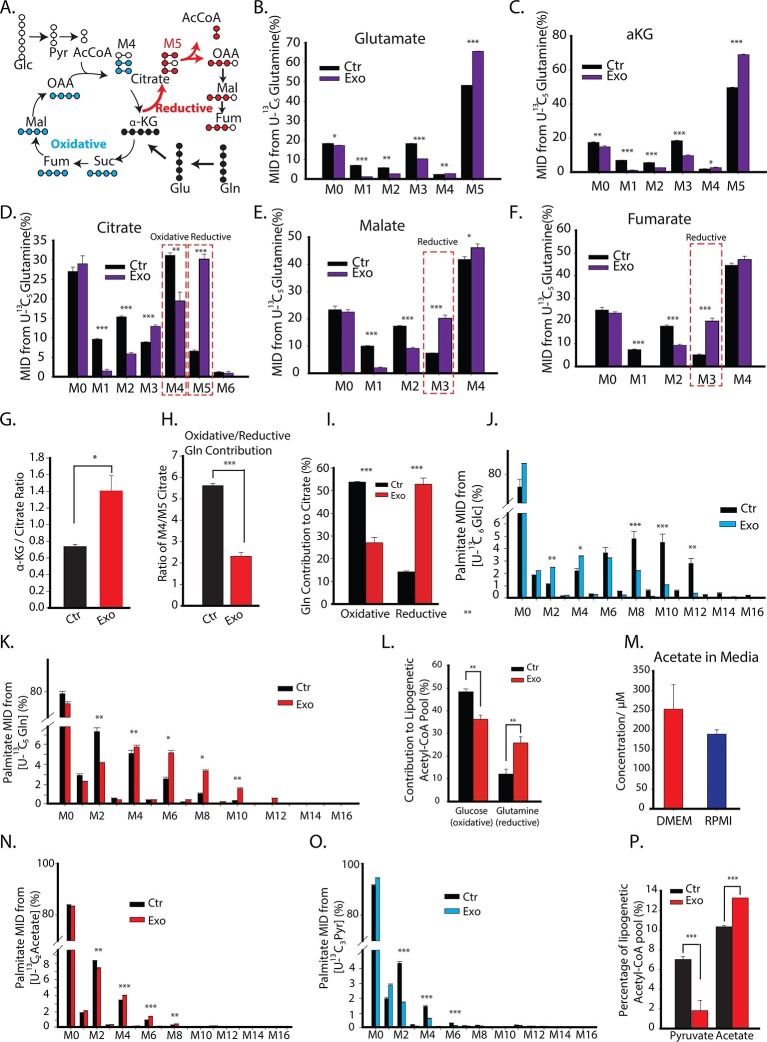
Figure 4. CDEs increase glutamine driven reductive carboxylation and lipogenesis in prostate cancer cells.
(A) Schematic of carbon atom transitions using 13C5 glutamine. Black color represents labeled carbon of glutamine before entering into TCA cycle. Blue color represents glutamine's direct effect on canonical TCA cycle and red color represents glutamine's effect on TCA cycle through reductive carboxylation. (B–F) Mass isotopologue distribution (MID) of glutamate, α-ketoglutarate, citrate, malate, and fumarate in PC3 cancer cells cultured with and without CDEs in U-13C5 glutamine (n=4). (G) Ratio of α-ketoglutarate and citrate pools in PC3 cancer cells cultured with and without CDEs measured using GC-MS. Higher ratio correlates with higher glutamine driven reductive carboxylation (n=4). (H–I) Ratio of glutamine contribution to citrate via oxidative and reductive pathways. Lower ratio indicates higher reductive carboxylation. CDEs increased reductive glutamine metabolism in PC3 cells (I). Oxidative contribution to citrate is determined by calculating M4 citrate percentage; reductive contribution to citrate is determined by M5 citrate percentage (n=4). (J) Glucose contribution to palmitate synthesis in PC3 cells cultured with or without CAFs exosomes for 72 hr was measured using GC-MS (n=6). (K) Glutamine contribution to palmitate synthesis in prostate cancer cells with or without CAFs exosomes measured using GC-MS (n=6). (L) Isotopologue spectral analysis (ISA) of both glucose and glutamine contribution to lipid synthesis in PC3 cells under control or CAFs exosomes culture conditions. CAFs exosomes enhance reductive carboxylation to lipid synthesis. However, total percentage of glucose and glutamine contribution to palmitate is about 60%. (M) Acetate concentration in cancer cell culture medium. (N) Acetate contribution to palmitate synthesis in PC3 cells with or without CAFs exosomes. Acetate spiked concentration was 500 μM (n=4). (O) Pyruvate contribution to palmitate synthesis in PC3 cells with or without CAFs exosomes (n=4). (P) ISA analysis of both pyruvate and acetate contribution to lipid synthesis in PC3 cancer cells under control or CAFs exosomes culture conditions. CAFs exosomes enhance acetate contribution to palmitate synthesis. Data information: data in (B–P) are expressed as mean ± SEM,*p<0.05, **p<0.01, ***p<0.001.


