. 2016 Apr 21;5:e13053. doi: 10.7554/eLife.13053

Figure 1. Quantitative analysis of the effects of binding proteins throughout the cell.

(A) A schematic diagram of S. cerevisiae indicating the cellular compartments and target proteins within the cell that were associated with each member of the proteome. (B) A 1536 colony plate from the Sec63 screen. The inset below shows the highlighted row from the Sec63-GBP plate, the Sec63 control plate and the GBP-only control plates respectively. Growth defects are indicated with a black line. (C) The z-scores of all 5734 proteins in each of the 23 screens. For each screen, the strains are ranked according to order of z-scores, positive z-scores indicate a growth defect relative to controls. The inset highlights the strains with the largest growth defects in each screen.

DOI: http://dx.doi.org/10.7554/eLife.13053.003
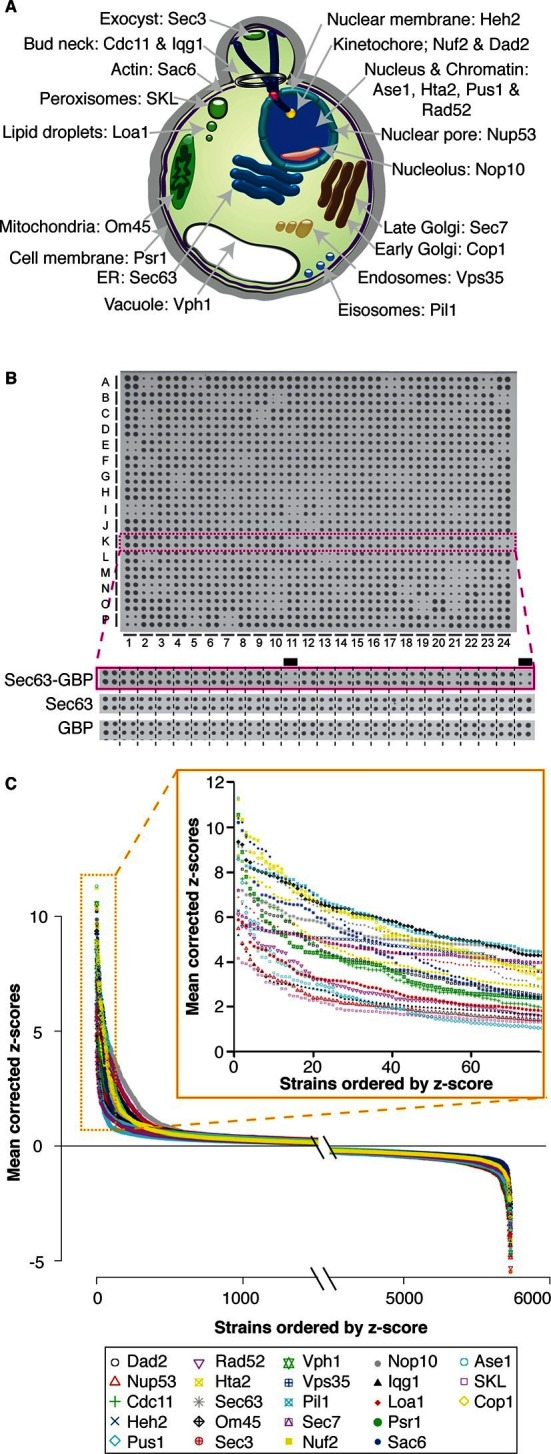
Figure 1—source data 1. Z-scores of growth defects caused by protein associations.
The z-scores for each binary protein interaction are listed for each control. The mean smoothed z-scores, plotted in panel C, are listed separately.
DOI: 10.7554/eLife.13053.004
Figure 1—source data 2. Plasmids used in this study.
A list of the plasmids used to generate the SPI data are listed.
DOI: 10.7554/eLife.13053.005

Figure 1.

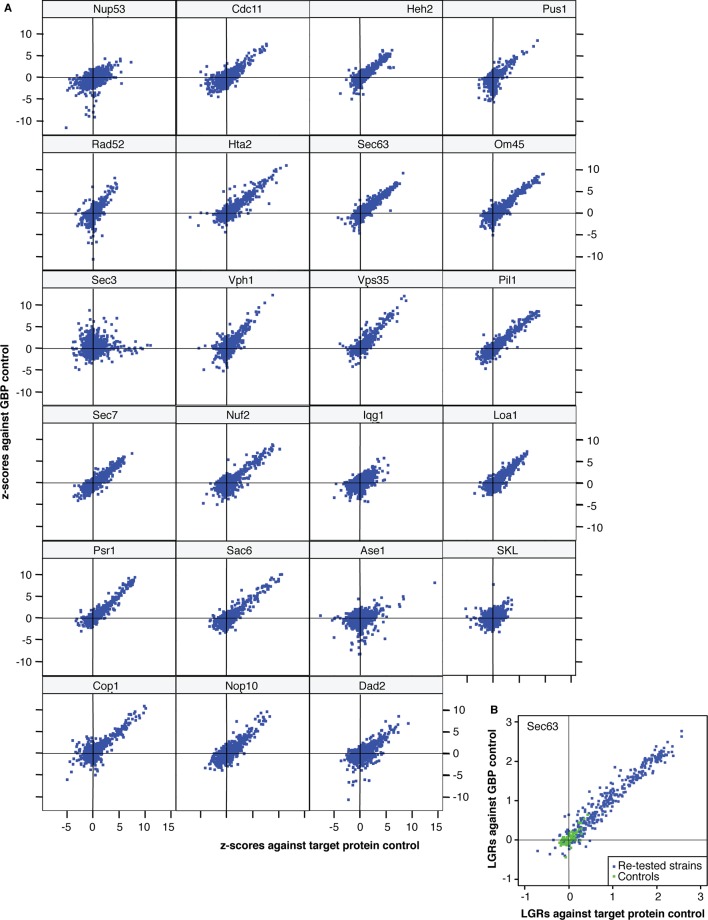
Figure 1—figure supplement 1. The correlation between the two controls.

Figure 1—figure supplement 1.

(A) x-axis: z-scores quantifying the difference in colony sizes between strains expressing the target protein fused with GBP and strains expressing the target protein alone, to control for the effects of ectopic expression. y-axis: z-scores quantifying the difference in colony sizes between strains expressing the target protein fused with GBP and strains expressing the GBP alone, to control for the effects of binding a protein to the GFP tag. A positive z-score indicates a growth defect of the GBP-tagged target protein relative to its control. (B) The relative growth (Log Growth Ratios, LGRs) from the high-density re-testing of Sec63-GBP SPIs relative to the two controls (the target protein alone – x-axis and the GBP alone – y-axis). The relative growth of the negative controls (no GFP tagged protein) are shown in green, whereas the retested Sec63 SPIs are shown in blue.