. 2016 Apr 21;5:e13053. doi: 10.7554/eLife.13053

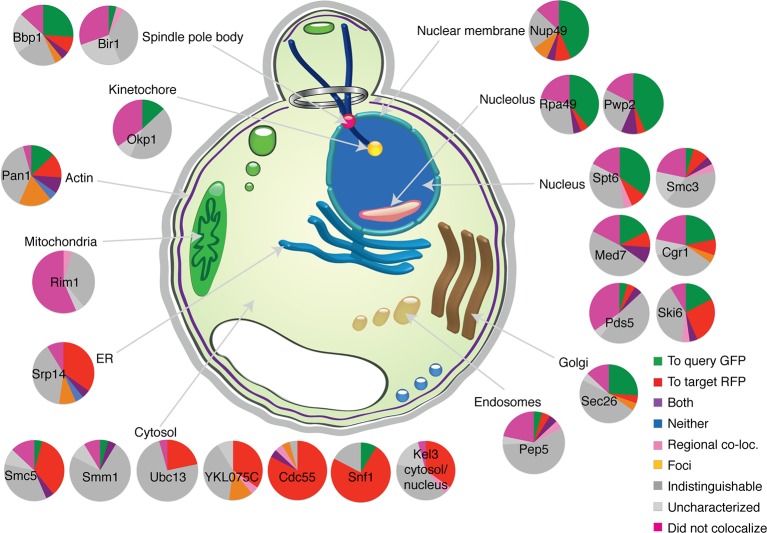
Figure 3. Direction of colocalization.

(A) The proportion of the 24 query proteins that colocalized in the direction indicated. Categories used to characterize the direction of colocalization are described in Figure 2. The ‘Uncharacterized’ category includes strains where there were no cells to image, which is often the case if the interaction perturbs growth.

DOI: http://dx.doi.org/10.7554/eLife.13053.011

Figure 3.

Figure 3—figure supplement 1. Direction of colocalization.

Figure 3—figure supplement 1.

A pie chart for each of the 24 randomly selected query proteins shows the proportion of the 23 target proteins observed to have colocalized in the direction indicated. Categories used to characterize the direction of colocalization are described in Figure 2.