
Figure 10. Ki-67 controls heterochromatin organisation.
(A) Top, immunofluorescence analysis of H3K9me3 in mouse NIH-3T3 WT and Mki67 TALEN mutant clones 60 and 65. Bars, 5 µm. Below: graphs showing quantification of pixel intensity scans for H3K9me3. (B) Quantification of H3K9Me3 patterns in WT and Ki-67 mutant clones. (C) Immunofluorescence of H3K9Me3, FISH of major satellite DNA and DAPI staining in WT W4 and Ki-67 mutant clone 60. Bar, 10 µm.

Figure 10—figure supplement 1. Heterochromatic histone mark localisation requires Ki-67.

Immunofluorescence analysis of H3K9me3 (left) and H4K20me3 (right) localisation in stable control and Ki-67 knockdown U2OS cells. Right: Fire look up table (F-LUT) pseudocolouring of immunofluorescence staining intensity, generated using Fiji software (Schindelin et al., 2012). Dotted white lines denote nucleolus, while numbers 1–4 identify cells for insets as well as staining patterns within nucleolus (1,2) or outside the nucleolus (3,4). Histograms below show the percentage of cells counted showing each pattern. The 2D Fire-LUT surface plot was generated using Fiji software(1). Scale bar: 10 μm.
Figure 10—figure supplement 2. Heterochromatic histone mark localisation requires Ki-67.

Immunofluorescence analysis of H3K9me3 (left) and H4K20me3 (right) localisation in stable control and Ki-67 knockdown HeLa cells. Right: Fire look up table (F-LUT) pseudocolouring of immunofluorescence staining intensity. Dotted white lines denote nucleolus, while numbers 1–4 identify cells for insets as well as staining patterns within nucleolus (1,2) or outside the nucleolus (3,4). Histograms below show the percentage of cells counted showing each pattern. Scale bar: 10 μm.
Figure 10—figure supplement 3. Heterochromatic histone mark localisation requires Ki-67.

Immunofluorescence analysis of H3K9me3 and H4K20me3 localisation in stable control and Ki-67 knockdown hTERT immortalised human fibroblasts (HDF BJ hTERT) cells. Scale bars, 10 µm.
Figure 10—figure supplement 4. Overall heterochromatic histone mark levels do not change upon Ki-67 knockdown.
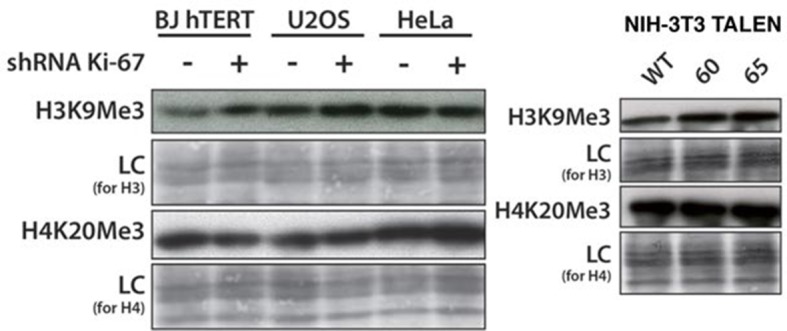
Left: western blot of total H3K9me3 and H4K20me3 level in control and stable Ki-67 knockdown BJ-hTERT, U2OS and HeLa cells. LC, loading control. Right: western blot of total H3K9me3 and H4K20me3 level in NIH-3T3 WT clone W4 and Ki-67-negative TALEN clones 60, 65. LC, loading control
Figure 10—figure supplement 5. HP1 localises normally to chromocentres in Ki-67 mutant cells.

Immunofluorescence analysis of localisation of HP1α, HP1β and HP1γ in WT and Ki-67-negative NIH-3T3 mutant clones 60 and 65, as compared with DAPI staining.