
Figure 8. Ki-67 is not required for rRNA biogenesis but controls gene transcription.
(A) Northern-blot analysis of total RNA extracted from HeLa and U2OS cells constitutively expressing shRNA against Ki-67; and HeLa, U2OS, HCT-116 and HCT-116 TP53 (-/-) depleted of Ki-67 by siRNA for 72 hr in two biological replicates (#1 and #2) or with scrambled siRNA control (Scr). Pre-rRNA intermediates were analysed by probing with different primers located in the different spacers of the 47S sequence (5’ETS-green; ITS1-blue; ITS2-purple). (B) Quantification of 47S rRNA precursor in HeLa, HCT-116 and HCT-116 TP53 (-/-) depleted of Ki-67 by siRNA for 72 hr in three biological replicates (n=1–3). (C) U2OS cells (left) or HeLa cells (right) show transcriptome profile differences (fold change >1.5; corrected p-value <0.02) between asynchronous cells constitutively expressing control (CTRL) or Ki-67 shRNA. Heat-maps present the expression levels of differentially expressed genes between biological replicates (1,2,3) and technical replicates (3, 3*). Data is provided in Figure 8—source data 1 and 2.
DOI: http://dx.doi.org/10.7554/eLife.13722.032

Figure 8—figure supplement 1. Ki-67 depletion does not hinder rRNA transcription.
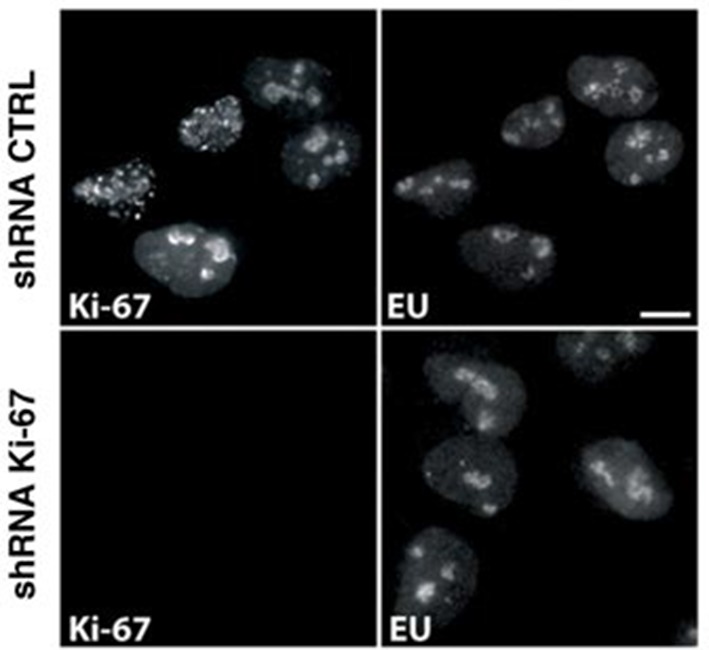
Figure 8—figure supplement 2. Human pre-rRNA processing pathway involves two major pathways.
