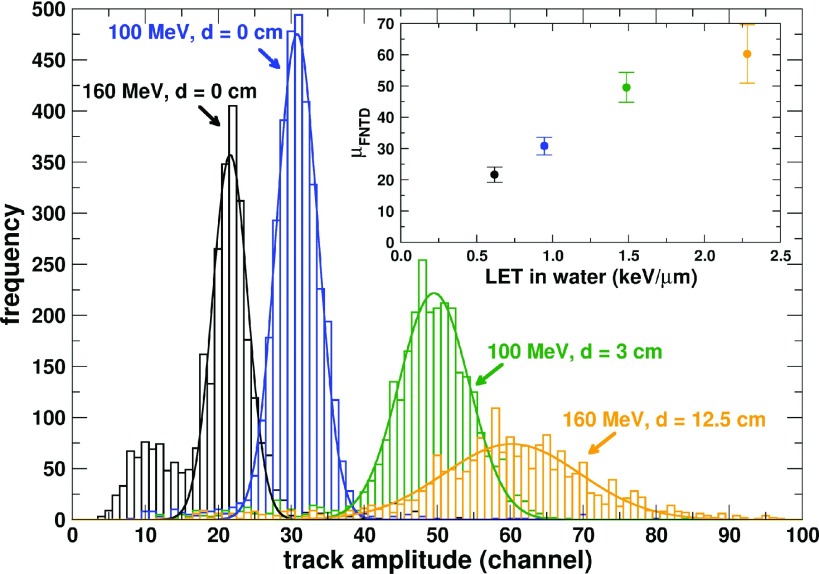
FIG. 2.
Track amplitude histograms (bars) obtained from FNTD chips exposed to the indicated conditions. The solid lines are Gaussian fits. Frequency is the number of tracks per channel. The inlay shows the peak position μFNTD of the Gaussian fits as a function of the fluence average LET of each condition (Table I). The error bars in the inlay represents the standard deviation of the Gaussian fit.

