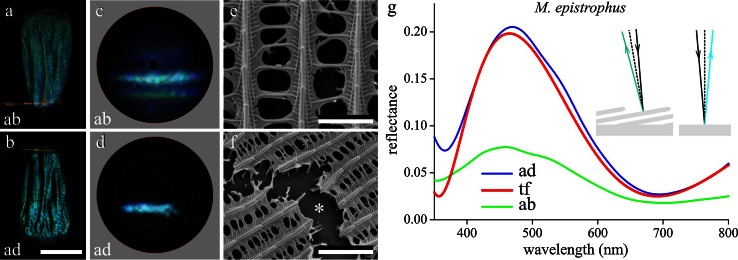
Fig. 2.
A single scale of M. epistrophus. a, b Micrographs of the upper (abwing) and lower (adwing) side, respectively. c, d The corresponding scatterograms of a central scale area with diameter ~30 µm. The red circles in the scatterograms indicate angles of 5º, 30º, 60º and 90º. e Scanning electron micrograph of a scale showing a few ridges and crossribs, framing open windows. f Similar micrograph of a damaged scale area, showing the flat lower lamina. g Reflectance spectra of both the adwing (ad) and abwing (ab) side measured with a microspectrophotometer together with the calculated reflectance spectrum of a chitinous thin film (tf) with thickness 225 nm (with 0.02 offset); inset difference in direction of reflected light by ridge lamellae and lower lamina. Bars a, b 100 µm; e 2 µm; f 4 µm

