
Figure 3. Relative odds of combined dysglycemia and dyslipidemia associated with race/ethnic groups by BMI category.
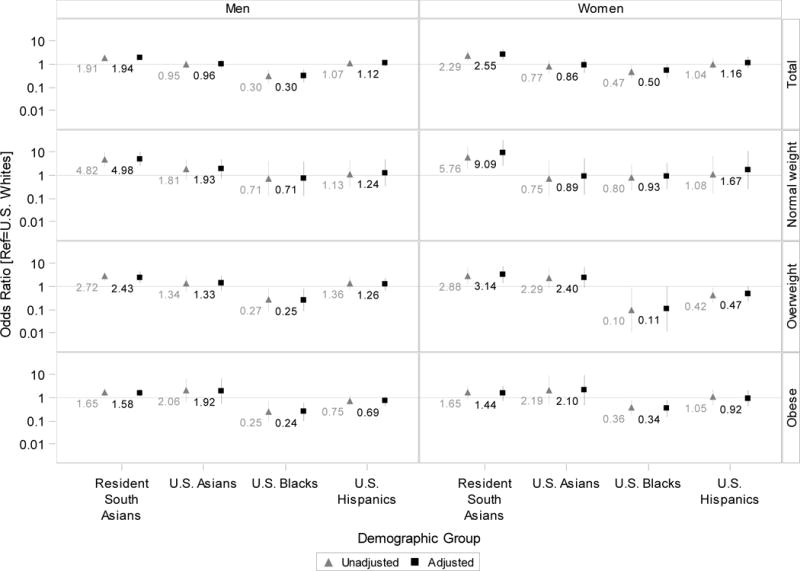
Odds ratios are plotted on a logarthmic axis (base 10) to better display positive and inverse asociations on the same chart. The horizontal line marks the null value (odds ratio=1).