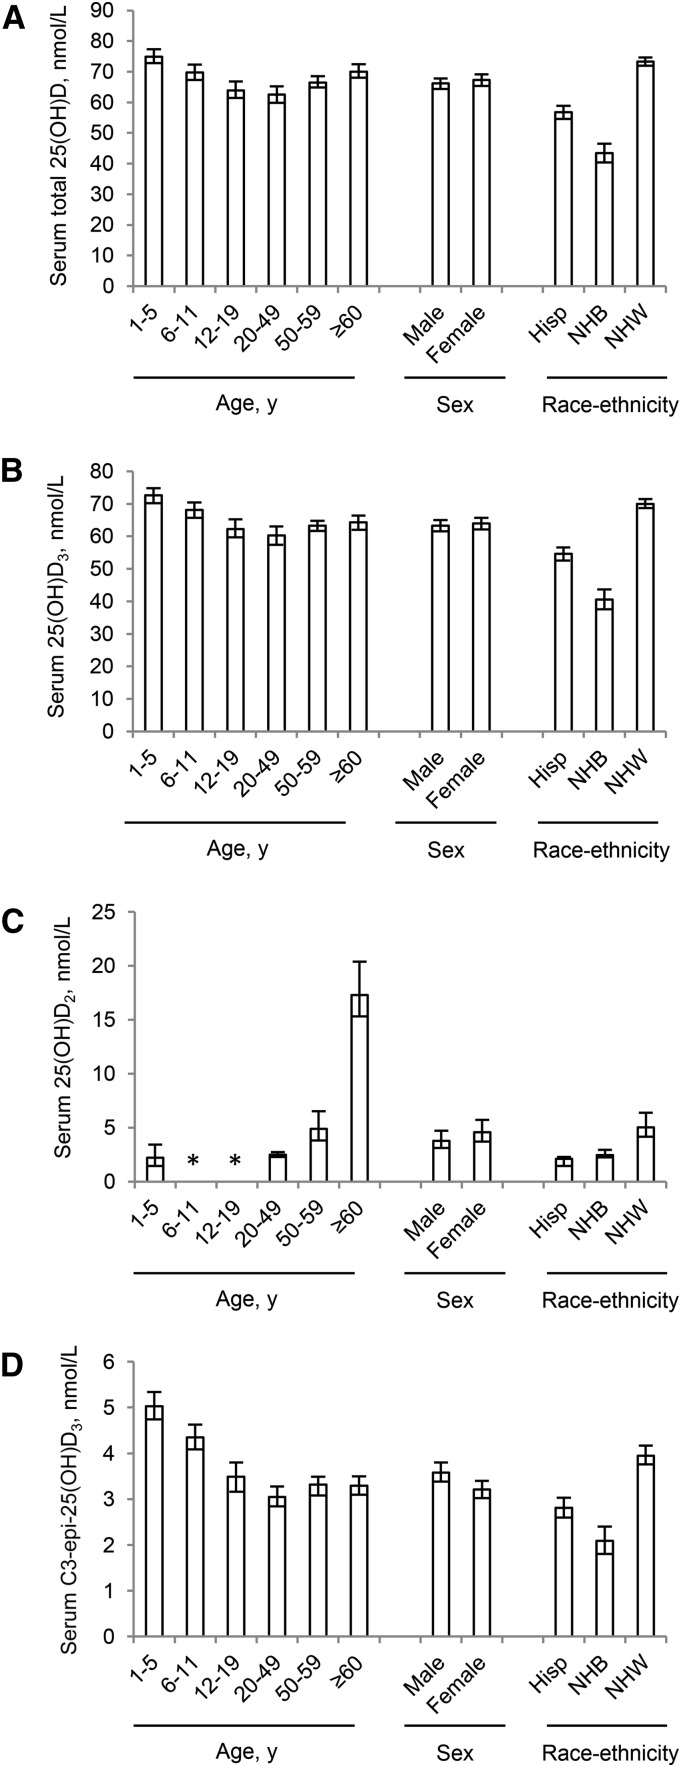
FIGURE 1.
Demographic patterns of total 25(OH)D (A), 25(OH)D3 (B), 25(OH)D2 (C), and C3-epi-25(OH)D3 (D) for persons aged ≥1 y: NHANES 2007–2010. Values are medians for total 25(OH)D, 25(OH)D3, and C3-epi-25(OH)D3 and 90th percentiles for 25(OH)D2; error bars denote 95% CIs. *25(OH)D2 concentrations were less than the limit of detection (i.e., <2.05 nmol/L) for participants aged 6–11 and 12–19 y. C3-epi-25(OH)D3, C3-epimer of 25-hydroxycholecalciferol; Hisp, Hispanic; NHB, non-Hispanic black; NHW, non-Hispanic white; 25(OH)D, 25-hydroxyvitamin D; 25(OH)D2, 25-hydroxyergocalciferol; 25(OH)D3, 25-hydroxycholecalciferol.

