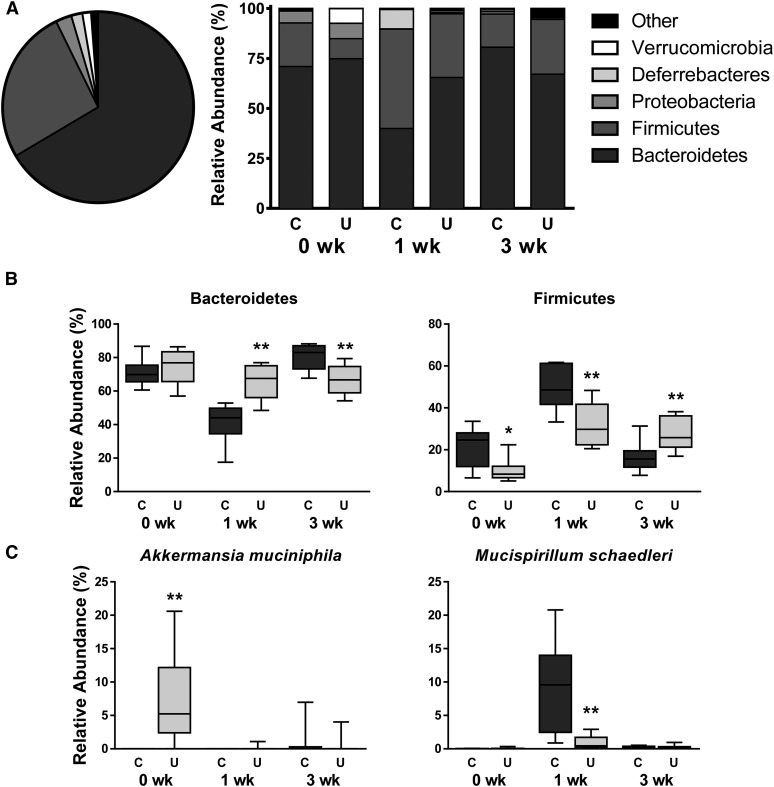
FIGURE 5.
Relative abundance of fecal bacteria in mouse pups from the C and U groups at 15, 22, and 36 d of age. (A) Phylum-level relative abundance plots depicting all groups combined on one pie chart and individual treatment groups in stacked bars. (B) Changes over time in most abundant phyla, Bacteroidetes and Firmicutes. (C) Changes over time in mucolytic species A. muciniphila and M. schaedleri; see also Supplemental Figure 5. The x axes depict time since ending FD; n = 8 mice/group. *,**Different from C: *P < 0.05, **P < 0.01. C, control mice; FD, feed deprivation; U, mice undernourished from 5 to 15 d of age.

