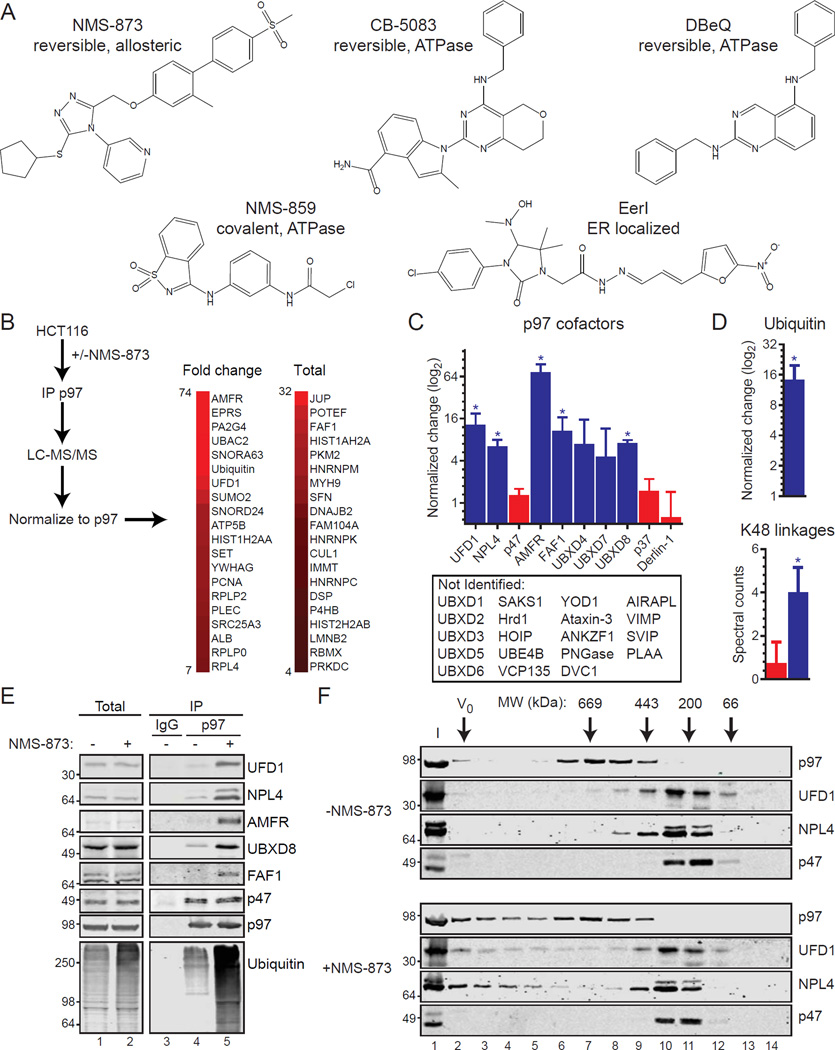
Figure 1. Allosteric inhibition alters cofactor and polyubiquitin binding to p97.
(A) Chemical structures of p97 inhibitors are shown.
(B) LC-MS/MS analyses of p97 complexes purified from HCT116 cells with or without 5 µM NMS-873 for 6 hours were performed. The top 20 NMS-873-associated interactors are shown based on protein spectrum count for fold change (left) or total (right). Extended data are in Supplemental Data File S1.
(C) The binding of several p97 cofactors is increased with NMS-873 (blue) while others do not (red). P97 cofactors not identified in LC-MS/MS analyses are also shown (below). Data represent the mean (fold change or total; n=4; *, p-value ≤ 0.05, log2 scale) and standard deviation (SD) error.
(D) Normalized increase (log2 scale) of ubiquitin purifying with p97 after NMS-873 treatment (top) and spectral counts of p97-associated K48 ubiquitin linkages with (blue) and without (red) NMS-873. Data represent the mean (n=4) and SD error (*, p-value ≤ 0.05)
(E) P97 from cells treated with NMS-873 (5 µM, 6 hours) was subjected to immunoblotting (IB). Total: input cell extracts; IP: immunoprecipitation; IgG: non-specific antibody control purification.
(F) Cell extracts from control (-NMS-873, top) or NMS-873 treated (bottom) were separated by size exclusion chromatography and analyzed by IB. Calibration standards are shown. I: input extracts; V0: void.

