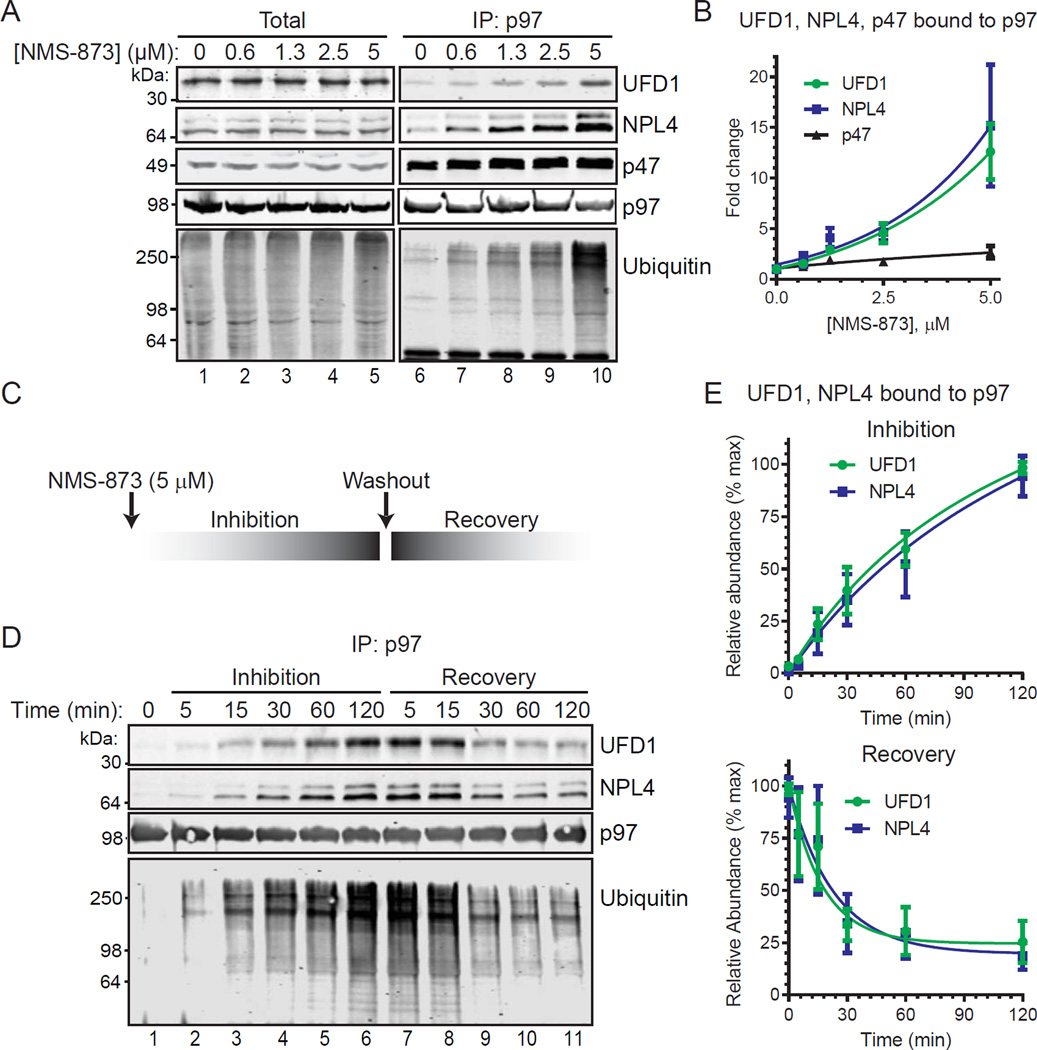
Figure 2. Binding of UFD1/NPL4 and polyubiquitin to p97 with NMS-873 is concentration dependent and reversible.
(A, B) HCT116 cells were treated with NMS-873 for 1 hour and cell extracts (Total) or purified p97 (IP:p97) were analyzed by IB. Mean fold changes (n=3, SD error) for UFD1, NPL4, and p47 with NMS-873 are shown in (B).
(C) Experimental scheme to measure time dependent UFD1/NPL4 binding to p97 with NMS-873 inhibition and recovery. After 120 minutes with 5 µM NMS-873, cells were washed with PBS prior to addition of media without NMS-873.
(D, E) Purified p97 complexes (5 µM NMS-873) were analyzed by IB. Mean change (n=3, SD error) in relative abundance of bound UFD1 and NPL4 are shown in (E). Steady state levels of proteins in cell extracts are in Figure S1.

