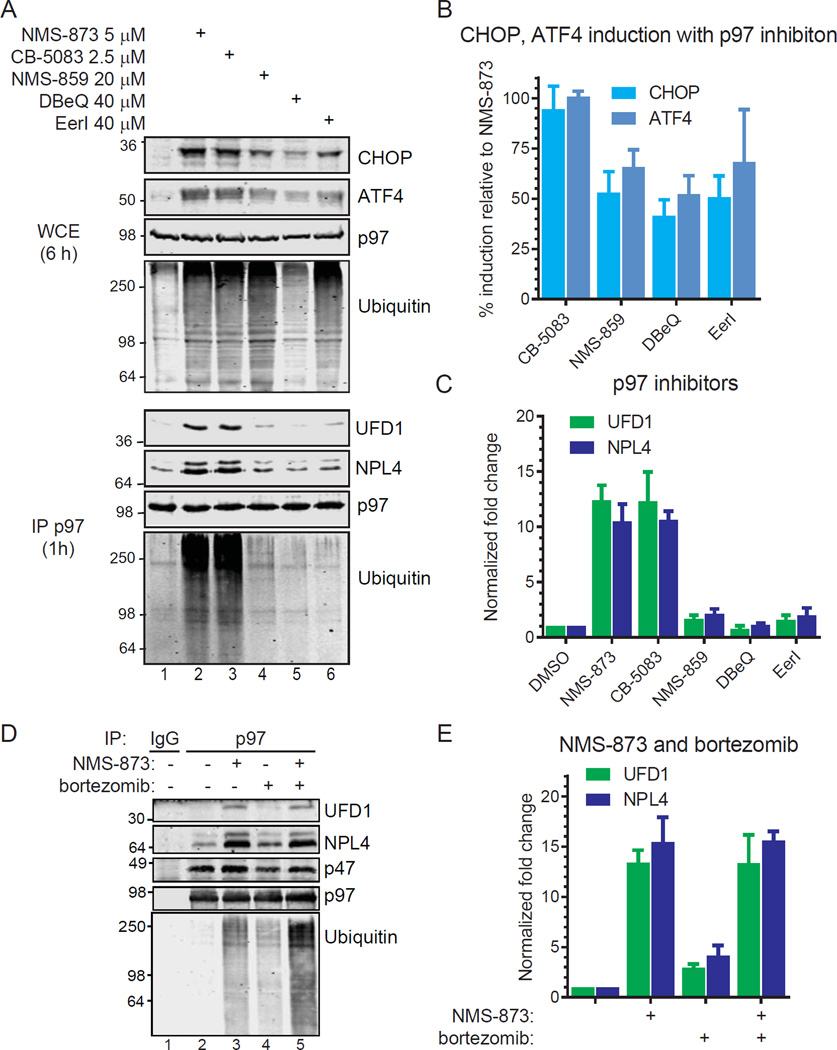
Figure 3. Enhanced UFD1/NPL4 and ubiquitin binding is a biomarker of p97 inhibition.
(A, B, C) HCT116 cells were treated with p97 inhibitors for 6 hours to analyze known biomarkers of p97 inhibition (top panels; CHOP, ATF4, ubiquitin) in cell extracts or 1 hour to analyze purified p97 for UFD1, NPL4, and ubiquitin (bottom panels). The % induction of CHOP and ATF4 relative to NMS-873 is in (B). The fold change for UFD1 and NPL4 bound relative to control p97 purifications is in (C). Data represent the mean (n=3, SD error).
(D, E) HCT116 cells were treated for 6 hours with NMS-873 (5 µM) and bortezomib (3 µM) prior to analyses. Steady state levels of proteins in cell extracts are in Figure S2. The amount of UFD1 and NPL4 bound to p97 were quantified (n=3, SD error).

