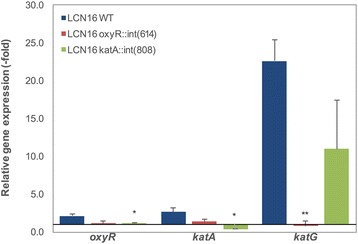
Fig. 6.

Relative gene expression of oxyR, katA and katG genes in wild-type Serratia sp. LCN16 (WT) and Serratia sp. LCN16 mutants (oxyR::int(614) and katA::int(808)), after H2O2-shock induction. The x-axis was positioned for 1.0, which indicates that the level of gene expression between stress and non-stress conditions is similar. Values were normalized using reference gene gyrA, and analyzed with ΔΔCT method. Error bars indicate standard deviation. Asterisk (*, **) on the top of the columns denotes statistical differences at 95–99 % confidence level by Students T-test (EXCEL version 15.14), when compared with wild-type Serratia sp. LCN16
