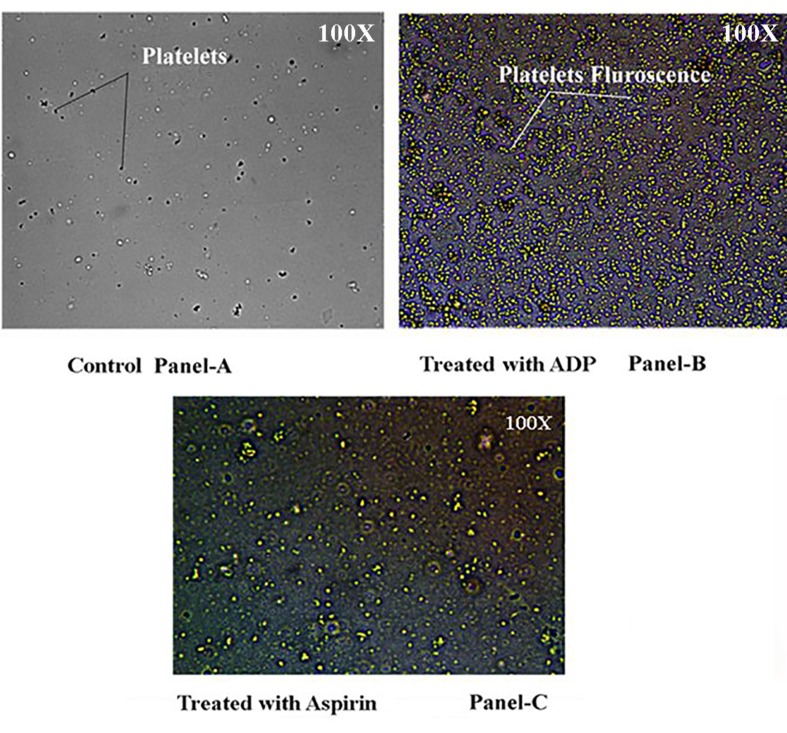
Figure 3.
Visualization of the cytosolic Ca2+ in platelets treated with Quin-2/AM by fluorescence microscopy in the presence of ADP. Washed platelets were loaded with 5 μM QUIN-2/AM with ssubsequent addition of 4.0 µM ADP or with and 80 µM aspirin together when required to the reaction mixture and are mounted on a glass slide to be seen in a fluorescent microscope. Panel-3A shows the presence of non-aggregated platelets (black arrows) in the presence of DMSO (Vehicle for QUIN-2/AM) only. Panel-3B shows the platelets treated with QUIN-2 and ADP. The presence of aggregated platelets (shown with arrows) with yellow color fluorescence is seen due to the interaction of Ca2+ with QUIN-2. Panel-3C shows the QUIN-2 labeled platelets treated with both aspirin and ADP. The decrease in intensity of the yellow fluorescence is seen due to the effect of aspirin on blocking the interaction of Ca2+ with Quin-2. The magnification used in each case shown in the top right corner of the figure. The significance of the fluorescence was determined by the amount of Ca2+ released from the platelet dense granule as given in Figure 4. The figures shown are typical representative of six different experiments using 6 different human washed PRP samples.

