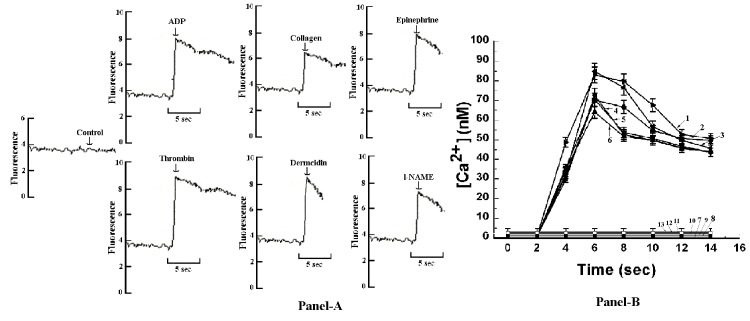
Figure 4.
Assessment of cytosolic Ca2+ mobilization in Quin-2 loaded platelets in the presence of all the aggregating agents by fluorescence spectrophotometric assay. Washed platelets were treated with 4 µM ADP and quantization of [Ca2+] was performed using fluorescence spectrophotometer. Panel-4A shows fluorescence recordings in response to the addition of all the aggregating agents to the Quin-2 loaded platelet suspension. The increase of cytosolic Ca2+ was determined by fluorescence spectrophotometer by determining fluorescence of free Ca2+ due to interaction of Ca2+ with Quin-2/AM. Panel-4B shows the increase of intracellular [Ca2+] treated with all the aggregating agents at different time intervals in the absence of external calcium. Line 1 indicates 1 U/ml thrombin, Line 2 indicates 0.1 µM dermcidin, Line 3 indicates 4 µM ADP, Line 4 indicates 5 µM epinephrine, Line 5 indicates 0.1 mM l-NAME, Line 6 indicates 2 µg/ml collagen, Line 7 indicates control (washed untreated PRP) and Line 8 -13 indicates [Ca2+] in case of washed PRP pre-treated with 5 mM EGTA along with addition of all the aggregating agents. The peak height of [Ca2+] in untreated platelets and in platelets treated with all the aggregating agents was found to be statistically significant where P<0.01 determined by Student´s t-test. Addition of the aggregating agents was made by syringe directly into the cuvette while the portions of platelet suspension were continuously stirred. Results shown are mean ± S.D. of atleast 15 other experiments each in triplicate using blood samples from 15 different volunteers (M=10, F=5).

