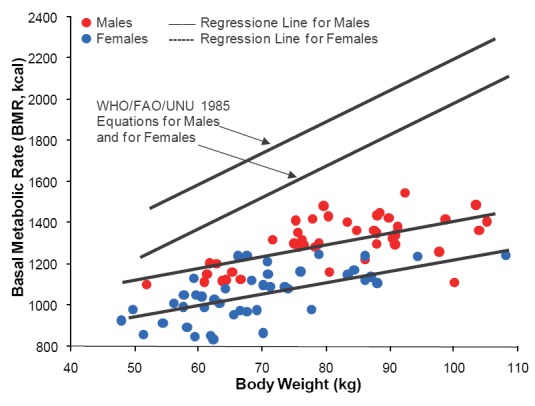
Figure 4.

Effect of body weight on basal metabolic rate (BMR) for male (n = 50) and for female (n=50) participants as modeled using the regressing equation based on the covariates: sex, weight, and total body capacitance (TBC) (Eq. 2). The solid and dotted lines represent estimates of BMR computed for average TBC for males and for females (i.e., 856.98 pF and 577.74 pF, respectively). The solid and dotted lines at the upper part of the figure are regression plots produced using the WHO/FAO/UNU equations based only on weight for males and for females (Eq. 3 and Eq. 4) (5), which overestimated BMR values by 30% on average as compared to study regressing equation.
