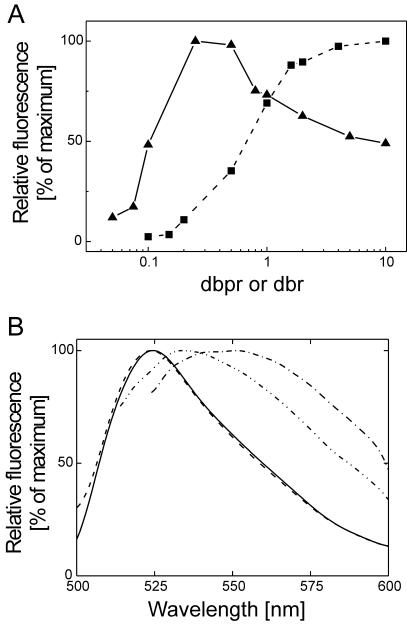
Figure 4.
Comparison of fluorescence of SG/ssDNA complexes and SG/dsDNA complexes. (A) Dependence of fluorescence intensities of SG/ssDNA complexes on dbr in comparison with the corresponding SG/dsDNA complexes. Samples containing 0.15 μM (in bp) EcoRI-digested pACYC184 plasmid (solid squares) or 0.3 μM (in bases) heat-denatured, EcoRI-digested pACYC184 plasmid (solid triangles) were incubated with increasing concentrations of SG (0–1.5 or 0–3 μM, respectively). For reasons of comparison, the fluorescence intensities of the SG/dsDNA complex and of the SG/ssDNA complex were set to 100% at a dbpr of 10 and 0.25, respectively. (B) Fluorescence spectra of SG in complex with dsDNA (EcoRI-digested pACYC184) at dbprs of 1 (dashed line) and 10 (solid line) and with ssDNA (heat-denatured EcoRI-digested pACYC184) at dbr of 1 (dash dot dot line) and 10 (dash dot line).

