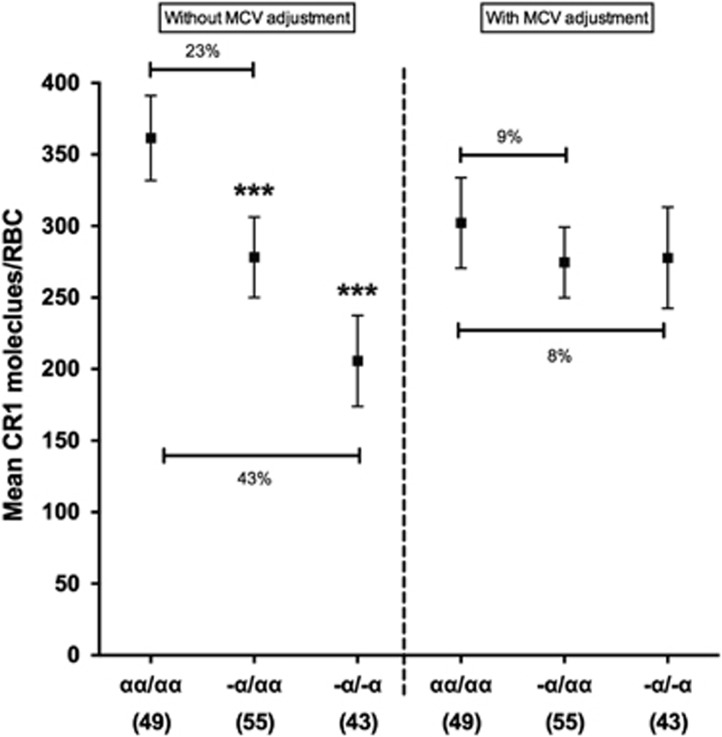
Figure 3.
MCV largely accounts for the association between α+thalassaemia and RBC CR1 level. Association between RBC CR1 level and α+thalassaemia in 147 samples without adjustment for MCV (left side), or with adjustment for MCV (right side). Differences in CR1 level by α+thalassaemia were first analysed by multivariate linear regression analysis with adjustment for age, HbAS and Sl and McC genotypes and compared with a separate model with the additional adjustment for MCV. The normal globin genotype (αα/αα) was used as the reference genotype. Error bars represent 95% confidence intervals of the mean RBC CR1 level. The percentages shown represent the relative difference in mean CR1 level between the respective genotypes. Numbers in parenthesis reflect total number of samples tested for each genotype group. Statistically significant differences in RBC CR1 level from the reference genotype are asterisked, ***P<0.001.

