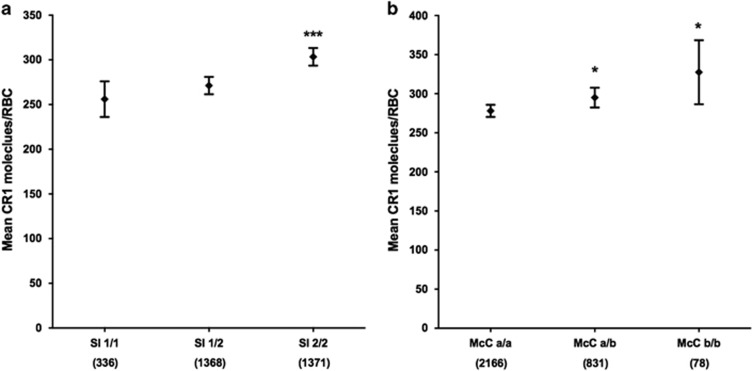
Figure 5.
RBC CR1 level varies by Swain-Langley and McCoy genotypes. RBC CR1 level by CR1 Knops blood genotype. (a) Swain-Langley (Sl) and (b) McCoy (McC). Differences in RBC CR1 level by Sl and McC genotypes were tested in a total of 3075 individuals by multivariate linear regression analysis with adjustment for age, α+thalassaemia and HbS genotypes. Error bars represent 95% confidence intervals of the mean RBC CR1 level. Numbers in parenthesis reflect total number of samples tested for each genotype group. The Sl1/1 and McCa/a genotypes were used as the reference genotypes, respectively. Statistically significant differences in RBC CR1 level from the reference genotypes are asterisked, *P<0.05, ***P<0.001.

