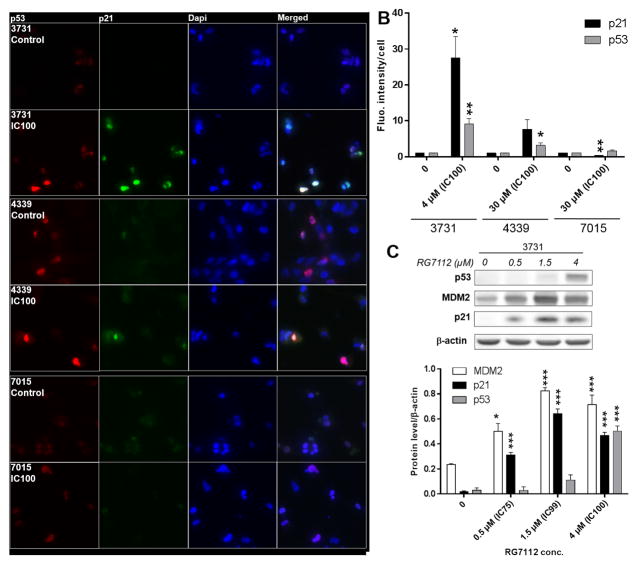
Figure 2.
p53 and p21 protein levels in GBM lines with or without MDM2 gene amplification and treated with RG7112. A) Representative immunofluorescence images of 3731MDM2_Amp/TP53_Wt, 4339MDM2/4_NL/TP53_Mut, and 7015MDM2/4_NL/TP53_Wt treated or not with RG7112. p53 (red), p21 (green) and cell nuclei (blue) can be seen. B) Protein levels were quantified by three independent immunofluorescence assays. Each bar represents the fluorescence intensity per cell normalized over the value obtained in the corresponding untreated control cells. C) p53, p21 and MDM2 protein levels in MDM2-amplified GBM line treated with RG7112.

